Getting Started: Middleware Monitoring


Welcome to RTView Cloud!

For middleware support teams and administrators, RTView Cloud is a hybrid monitoring and data visualization platform that enables users  to:

  • monitor different middleware technologies, including Solace, Kafka, and TIBCO, with out-of-box displays and alerts
  • create, share, and publish real-time custom dashboards for their monitoring data

No programming is required and all user data remains securely behind the firewall.

Quick Start Video


Brief guided tour for middleware monitoring with RTView Cloud. Also reviews important concepts and initial setup.

.      


Quick Start - Recommended Steps


 Step 1: Set up your RTView Cloud Account

Sign up for a free 30-day trial account. From your browser, navigate to https://rtviewcloud.sl.com/register

After verifying your email address, you will be able to log into RTView Cloud and go to RTView Cloud Home

 Step 2: In RTView Cloud, select your Solution Packages and Connect to Demo Data
  1. From your RTView Cloud home page, Select the settings (gear) icon in the top right.

2. Select "Packages"

3. Now you will see a list of available Packages. Click the "Add Package" button to add the package to your account

4. When you have finished, close the window

5. From your selected packages table, edit each package to enable "Sharing".

6. Now we will connect your Solution Packages to a set of simulated demo data. Navigate to the "Data" tab in the top panel of RTView Cloud

7. Click on the "Add RTView Demo Server" button in the top right of your display

8. Add the "Demo_Alert_Server" and the "Demo_Config_Server". Enable both servers for sharing, save, and close the window

You have now completed this step. Navigate to the "View" tab near the top of the display, then select the "Components" tab. You will see an Overview window with a summary for each of the Solution Packages you have selected.

 Step 3: Get Your Monitoring Data into RTView Cloud with a DataServer

You have two options for getting your monitoring data into RTView Cloud:

  • If you are new to RTView, and do not have an existing RTView on-premise system you would like to connect to, select option 1.
  • If you do have an existing RTView system you would like to connect to, select option 2.

Option 1: For New Users, Pick a DataServer and Download It 

Here are the currently available DataServers. Click here to download a 30-day free trial version.

RTView DataServer for TIBCO 
      for TIBCO ActiveMatrix, ActiveSpaces, FTL, EMS, BusinessWorks 5-6-BWCE, Hawk, TIBCO Adapters, and BusinessEvents

RTView DataServer for Solace
       for Solace PubSub+ Brokers and Software (formerly VMRs)

RTView Data Server for Kafka
       for Apache Kafka

RTView DataServer for Infrastructure
       for Amazon AWS, Docker, Microsoft SQL Server, MongoDB, MySQL, Node.js, RTView Host Agent, Red Hat JBoss, and VMware

RTView DataServer for IBM
       for IBM DB2, WebSphere, and WebSphere MQ

RTView DataServer for Oracle
      for Oracle Coherence, Oracle Database, Enterprise Manager, and WebLogic


Option 2: For Current Users of RTView, connect to Your Existing On-Premise DataServer


Connecting RTView Enterprise 4.x to RTView Cloud


 Connecting RTView Enterprise prior to versions 4.x

For EM version 3.x, the following additional steps are required to display Solution Package data to the cloud:

  • If EM is set up and running, then copy the <solution package>_rtvquery.war files from the %RTVAPM_HOME%/<solution package>/webappsdirectory (for example: %RTVAPM_HOME%/emsmon/webapps/emsmon_rtvquery.war).

  • Paste the .war files for each solution package into your application server's webapps directory (for example: apache- tomcat-<version>/webapps)

  • Start Tomcat (run the startup script located in the bin directory).

  • In a browser, enter the following to display the connected status for the rtvquery servlet:


http://<IP address>:<port>/<solution package>_rtvquery/cache/test.jsp?test=1

Using EMS Messaging Service and port 8068 as an example:

http://<IP address>:8068/emsmon_rtvquery/cache/test.jsp?test=1

  • If connected status for the servlet is false, then you should confirm that the Host and Port fields are correctly configured. The Host and Port fields refer to the data server host machine and data server socket port, respectively. To modify the data server connection parameters, edit the $CATALINA_HOME/webapps/rtvquery/WEB-INF/classes/com/sl/rtvquery/rtvquery.properties file, where CATALINA_HOME refers to the Tomcat home directory, and check the following properties for host (DataServerHost) and port (DataServerPort):

# DataServerHost : This property defines the name of the host 
# on which the RTView data server is running.  If this
# is the same host as the app server, use localhost. 

DataServerHost=localhost

# DataServerPort : This property defines the port number used
# by the Data Server. The default value is 3278

DataServerPort=3178

Quick Start - Optional Steps


 Step 5: Set up Alerts

Configuring Alerts


Optionally, you can configure an alert threshold database connection, enable alerts and modify default alert notification settings, enable alert persistence to save the alerts to the database, store alert history to a history database, and define a history table name prefix to help differentiate alert history data between multiple data servers.

Click here for instructions for configuring an alert database connection

 Step 6: Set up the Historian

Configuring the Historian Database

Optionally, you can create a Historian Database connection that saves your incoming data to a database so that you can view your data metrics over a specified period of time in your various solution package displays. 

Guide for creating the database connection and modifying historian default settings


 Step 7: Scaling for Performance

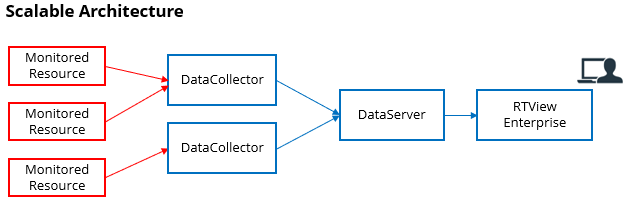
You can use RTView DataCollectors in conjunction with DataServers when you want to scale to monitor very large systems.


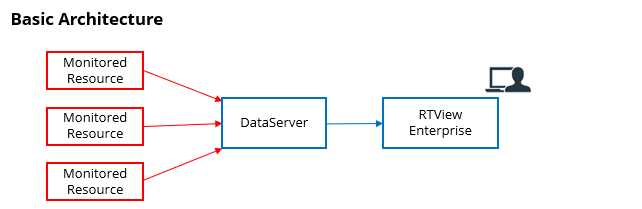
The DataCollector and DataServer are data servers that allow you to collect data from other data sources via connections that you specify in the RTView Configuration Application, which is contained within each deliverable. DataCollectors act as “sender” data servers, which collect data from your configured data sources and send the collected data to the associated DataServer (“receiver data server”).

The DataServer, which also allows you to configure historian and alert database connections, automatically collects data from the associated DataCollector as well as from any additional data sources to which you configure connections. This data can then be viewed in either RTView Cloud by creating a connection to the data server in RTView Cloud or in RTView Enterprise by connecting the data server to RTView Central (RTView Enterprise ) using the EM Integration tab in the RTView Configuration Application. The entire installation, setup, and verification steps are described in detail in the DataServer and DataCollector Quick Start Guides.


Recommended Steps

  • Step 1: Set up your RTView Cloud Account
  • Step 2: In RTView Cloud, select your Solution Packages and Connect to Demo Data
  • Step 3: Get Your Monitoring Data into RTView Cloud
  • Step 4: Configure your DataServer


Optional Steps

  • Step 5: Set up Alerts
  • Step 6: Set up the Historian
  • Step 7: Scaling for Performance