Configuring TIBCO BusinessWorks, Version 5.1.1
This section discusses the setup that is required in both versions of TIBCO BusinessWorks to enable monitoring, as well as the steps needed to install, configure, and setup the Solution Package for TIBCO BusinessWorks (versions 5 and 6).
Required Setup in TIBCO BusinessWorks (Versions 5 and 6)
Some setup is required in TIBCO BusinessWorks Versions 5 and 6 to enable monitoring. For Version 6, there are two options: You can either install the OSGi plugin in every AppSpace you want to monitor, or you can enable the TIBCO Hawk MicroAgent in each AppSpace you want to monitor. Monitoring via the OSGi plugin is recommended for better performance and reliability.
For Version 5, monitoring must be done via TIBCO Hawk, which is enabled by default, but you also need to install the RTViewBWAgent plug-in microagent. If you enable JMX monitoring, you can access additional data such as CPU and Memory data. For BWSE engines, additional setup is needed to allow access to AMX Node data.
Enable Monitoring via OSGi Plugin for Version 6
This section describes the “Prerequisites” and steps required to install the RTView OSGi (Open Service Gateway Initiative) BusinessWorks plugin into “RTView TIBCO BusinessWorks”, “Docker”, and “Cloud Foundry”.
Configuration
The RTView OSGi plugin is configured with the following properties:
| Property | Definition |
|---|---|
sl.rtview.rtvagent.name | The name by which the plugin will be identified in the RTView displays. This should be unique and should identify the sender using, for example the hostname. example: sl.rtview.rtvagent.name=hostname |
| sl.rtview.rtvagent.target | The host and port of the receiving RTView dataserver. example: sl.rtview.rtvagent.target=receiver:3272 |
| sl.rtview.rtvagent.update | Defines how often the plugin sends data, in seconds. example: sl.rtview.rtvagent.update=30 |
| sl.rtview.bw.activities.enabled | This property enables BW6 activity metrics to be collected. example: sl.rtview.bw.activities.enabled=true |
Note that the receiving RTView dataserver must be run using the -propfilter:receiver flag. This is the default for all RTView distributions except for RTViewDataCollector. If you are using that distribution you should add the flag to your start_servers command. For example:
start_servers.sh -propfilter:receiver
Containers
With the container deployments you may also use the following properties to provide specific names for the domain, appspace, and appnode:
sl.rtview.bw.domain
sl.rtview.bw.appspace
sl.rtview.bw.appnode
For example:
sl.rtview.bw.domain=Containers
sl.rtview.bw.appspace=Docker
sl.rtview.bw.appnode=docker-1
If you supply specific names then your containers will appear in the displays as if they were appnodes in an appspace. Furthermore, if multiple containers
are instances of the same application, the metrics of the container appnodes will be summed for the application, as if it were deployed to the appspace. If you don not supply specific names, the following names will be used:
domain: "standalone"
appspace: same as appnode
appnode: container ID (Docker) or container GUID (PCF)
If you do supply specific names, you can include variables from the container environment in the names by bracketing the environment variable name with '%'. For example, PCF containers have environment variables such as CF_INSTANCE_GUID and CF_INSTANCE_INDEX (The former is used for the appnode name if one is not supplied). If you wanted to name your appnodes "instance-1", "instance-2" etc. then you could supply an appnode name such as:
sl.rtview.bw.appnode=instance-%CF_INSTANCE_INDEX%
BusinessWorks
Prerequisites
BW 6.3 or later; Hotfix 2 or later
RTVAPM X.X
The plugin is configured using AppSpace properties with the following procedure.
- Stop all AppSpaces to be monitored. Stop the bwagent, if running.
- Copy the plugin jar to $TIBCO_HOME/bw/<version>/system/shared.
- Start the bwagent. Do not start any AppSpaces or AppNodes yet.
Note: Continue to the next step if you want to modify the default property values. You may skip the next 3 steps entirely if you want to use the default property values.
- Navigate to the system config folder: $TIBCO_HOME/bw/<version>/config/
- Copy the appspace_config.ini_template file to a temporary file.
- Edit the temporary file and set the properties as needed.
- Use the bwadmin config command to push the configuration to the AppSpace:
bwadmin config -d <domain> -cf <temporary-file> appspace <appspace>
- (Optional) For any AppNode, to see plugin output (INFO or TRACE) in the bwappnode.log file, add the following to the User Properties section of the logback.xml file, located at:
$TIBCO_HOME/bw/<version>/domains/<domain>/appnodes/<appspace>/<appnode>/logback.xml.
<logger name="com.sl.rtvapm.osgi">
<level value="INFO"/>
</logger>
Note: When debugging the behavior of the plugin, it is recommended to set level value to "TRACE".
- Restart the AppSpace.
- Repeat the previous 4 steps for every AppSpace to be monitored.
Note: When upgrading to a new version of the plugin jar, before restarting an AppSpace, it is advisable to delete the contents of the AppNode config directory for each AppNode in the AppSpace. The AppNode config directories are located at:
$TIBCO_HOME/bw/<version>/domains/<domain>/appnodes/<appspace>/<appnode>/config/.
BWCE: Docker
Prerequisites
BWCE 2.4.2 or later
RTVAPM X.X
You will build your Docker image using your application with the TIBCO base image and including the plugin jar. For example, below we use tibco.bwce.sample.BookStore as the application:
- Download bwce-runtime-<version>.zip from TIBCO and copy it into your BWCE installation at the following location:
$TIBCO_HOME/bwce/<version>/docker/resources/bwce-runtime
- Build the image as such:
cd $TIBCO_HOME/bwce/<version>/docker
docker build -t tibco/bwce:latest .
- Add the RTView OSGi plugin to your application by copying the application archive and the plugin jar (com.sl.rtvapm.osgi_<version>.jar) to your project directory.
- Create a Docker file containing:
FROM tibco/bwce:latest
MAINTAINER Tibco
ADD tibco.bwce.sample.BookStore.ear /
RUN mkdir -p /resources/addons/jars
ADD com.sl.rtvapm.osgi_<version>.jar /resources/addons/jars
EXPOSE 8080
- Build the application:
docker build -t tibco/bookstore:latest .
- Set the plugin properties described above using Java system properties, BW_JAVA_OPTS, and the Docker run command. For example:
OPTS="-Dsl.rtview.rtvagent.target=localhost:3272 \
-Dsl.rtview.rtvagent.name=<hostname> \
-Dsl.rtview.bw.domain=Containers \
-Dsl.rtview.bw.appspace=Docker"
docker run -i \
-e ... \
-e BW_JAVA_OPTS="$OPTS" \
-e ... \
tibco/bookstore:latest
- The plugin logs to the console at levels INFO and TRACE. You can set the log level for all packages with BW_LOGLEVEL. For example:
-e BW_LOGLEVEL=INFO
BWCE: Cloud Foundry
Prerequisites
BWCE 2.4.2 or later
RTVAPM X.X
- Download the bwce-buildpack_cf-<version>.zip file from TIBCO.
- Insert the plugin jar into the zip file at /resources/addons/jars. To insert plugin jar in the buildpack zip, proceed as follows on a unix system:
- make a copy of the buildpack zi. For example: bwce-buildpack_cf_rtv.zip
- make the directories ./bw-buildpack/resources/addons/jars and put the plugin jar in jars.
- update the buildpack zip: zip -u -r bwce-buildpack_cf_rtv.zip bw-buildpack
- remove ./bw_buildpack...
- Upload the buildpack to your cloud. For example:
cf create-buildpack bw-buildpack bwce-buildpack_cf-rtv.zip 1
- Set the plugin properties described above using Java system properties and BW_JAVA_OPTS in the manifest.yml file. For example:
. . .
env:
. . .
BW_JAVA_OPTS: '-Dsl.rtview.rtvagent.target=<receiver>:3272 -Dsl.rtview.rtvagent.name=<hostname> -Dsl.rtview.bw.domain=Containers -Dsl.rtview.bw.appspace=PCF'
. . .
- Push the application. For example:
cf push
Enable Monitoring via TIBCO Hawk for Versions 5 and 6
This section discusses the steps required to enable monitoring via TIBCO Hawk for TIBCO BusinessWorks (Versions 5 and 6).
ActiveMatrix BusinessWorks Version 6
Perform these instructions if you are monitoring BusinessWorks version 6:
- Enable your applications for statistics collection. You can do this using the TIBCO BusinessWorks administrator CLI with commands such as:
bwadmin enablestats -d MyDomain -a MyAppSpace process MyAppName MyAppVersion
Repeat for each application you wish to monitor.
- Enable the Hawk MicroAgent in your AppNodes for each AppSpace you wish to monitor. Refer to the Enabling TIBCO Hawk MicroAgent section of the TIBCO BusinessWorks6 Administration Guide.
BusinessWorks Version 5
This section is for BusinessWorks Version 5 users.
Note: This section does not apply if all your engines are deployed as BusinessWorks Service Engines (BWSE).
Install the RTViewBWAgent plug-in microagent in the Hawk Agent for each domain you have configured to communicate with the Monitor.
RTViewBWAgent detects deployed engines and gets their maximum heap size metrics when the Hawk agent is started. If RTViewBWAgent is not installed, deployed engines are not detected until they have been started and report data to the Monitor. When live data is received the engine is added and its Status is set to LIMITED. The Status remains LIMITEDbecause, although live data metrics are available, the deployment and maximum heap size metrics are still unavailable.
Note: After installation, you can use the Hawk Display to view the RTViewBWAgent microagent and invoke its methods: GetBWDeploymentNames and GetBWDeploymentMaxHeapSizes.
You can also configure the agent to detect deployed engines and make data updates at more frequent, specified intervals. To specify the update interval you uncomment the -update argument in the BWAgentPlugin.hma file and specify a non-zero value. When the -update argument is not used (is commented out), the Monitor does not report that an engine has been deployed or undeployed until the Hawk agent is restarted.
- Navigate to the agents/BWAgentPlugin directory of your Monitor installation and locate the following two files:
BWAgentPlugin.jar
BWAgentPlugin.hma
- For a given domain, find the plug-in directory via this path:
<TIBCO-home>/tra/domain/<domain-name>
- Repeat the second step for each Hawk domain you have configured to communicate with the Monitor.
- To (optionally) set RTViewBWAgent to make data updates at more frequent, specified intervals, open the BWAgentPlugin.hma file, uncomment the -update argument and specify a non-zero value. The value, which defaults to 300, represents the update interval in seconds. For example, a value of 3600 updates every hour:
<arguments>
<arg>-update:3600</arg>
. .
</arguments>
- Copy the BWAgentPlugin.jar file and BWAgentPlugin.hma file into the plug-in directory and restart the Hawk Agent.
Enable Monitoring via JMX for Version 5
BusinessWorks version 5 engines can also be enabled for JMX monitoring as documented in TIBCO BusinessWorks™ Administration, Monitoring the BusinessWorks Engine Using JMX.
Enable monitoring of BW5 engines via JMX
- To enable local JMX monitoring, add the following properties to bwengine.tra:
Jmx.Enabled=true
java.property.com.sun.management.jmxremote=true
To enable remote JMX monitoring, add the following properties to bwengine.tra: (Note <port_number> can be any available port)
java.property.com.sun.management.jmxremote.port=<port_number>
java.property.com.sun.management.jmxremote.authenticate=false
java.property.com.sun.management.jmxremote.ssl=false
For example, the BW Engine MyDomain.MyApp.Procs can be enabled for remote JMX monitoring by adding the following lines to the file:
C:\Tibco\tra\domain\MyDomain\application\MyApp\MyApp-Procs.tra:
#
# Enable JMX on port 9000
#
Jmx.Enabled=true
java.property.com.sun.management.jmxremote=true
java.property.com.sun.management.jmxremote.port=9000
java.property.com.sun.management.jmxremote.authenticate=false
java.property.com.sun.management.jmxremote.ssl=false
- After the BW Engine is enabled for JMX monitoring and restarted, it can be monitored by adding a JMX Connection property in the RTView Configuration Application where the Connection Name is the Engine name. See Configuring Data Collection for RTView Manager for more information.
Enable Monitoring of BWSE Engines for Version 5
This section is for TIBCO ActiveMatrix (AMX) users, and describes how to configure BW Monitor to monitor BWSE engines. BW Monitor needs access to AMX Node data stored in EMS message queues on the AMX Host system. To make this data available to BW Monitor you will create EMS topics with bridges from the queues.
The TIBCO BusinessWorks Service Engine (BWSE) is an ActiveMatrix (AMX) component that enables BW engines to participate in the implementation of AMX services. In this case, the BWSE engines run within an AMX Node and are not visible to BW Monitor. However, you can configure BW Monitor to display these engines, as well as to gather JVM memory metrics for the AMX Nodes in which they are running.
Configure for BWSE engines
- To configure the AMX Host, execute the following commands in the EMS administration tool (tibemsadmin):
create topic rtv.amx.governance.stats
create bridge source=queue:amx.governance.stats target=topic:rtv.amx.governance.stats
- In AMX Administrator, in the properties for each BWSE engine, set HawkEnabled to true.
Configuring Data Collection for Hawk (Version 5 or 6)
Note: Only the Classpath and Connections regions on the CONNECTIONS tab need to be set up for TIBCO BusinessWorks (Version 5 or 6). Modifying the configurations on the DATA COLLECTION and DATA STORAGE tabs is optional.
- Navigate to the Solution Package Configuration > TIBCO Hawk > CONNECTIONS tab.
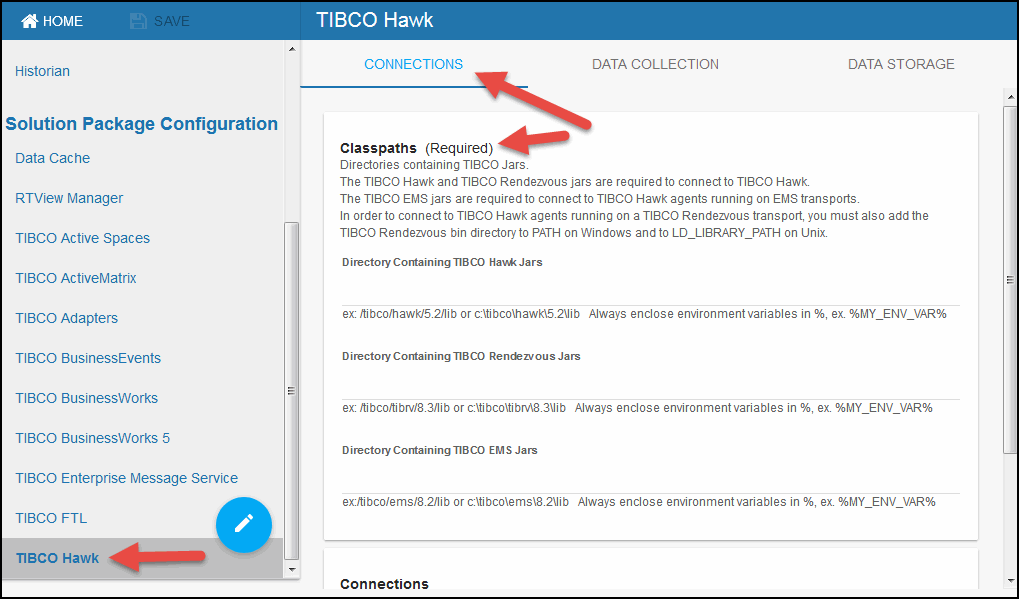
- In the CONNECTIONS tab, specify the classpaths for the TIBCO Hawk jar files, the TIBCO Rendezvous jar files, and the TIBCO EMS jar files.
Note: If using Version 6 and you have installed the OSGI plugin, TIBCO Hawk connections are not needed.
- Click the
 icon.
icon.
The Add Connection dialog displays.
- For TIBCO Hawk domains running on EMS transports, specify the connection information and click SAVE where:
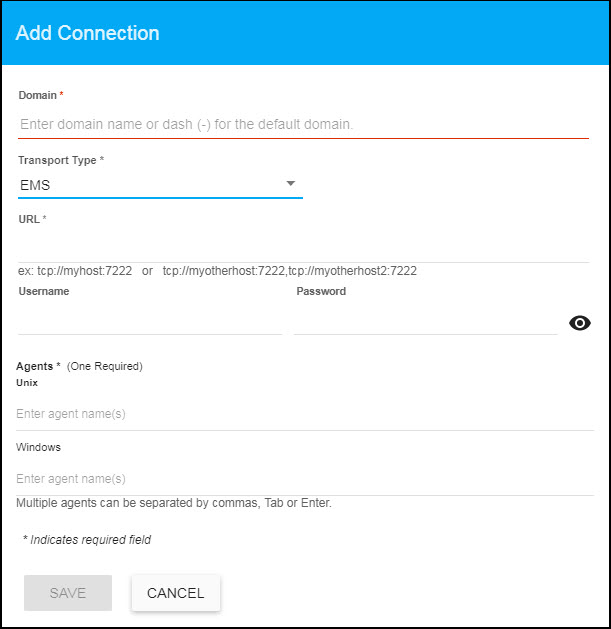
Domain: Enter the name of the domain.
Transport Type: Select EMS from this drop down list.
URL: Enter the complete URL for the EMS connection.
Username: The username is used when creating the EMS connection. This field is optional.
Password: This password is used when creating the EMS connection. This field is optional. By default, the password entered is hidden. Click the  icon to view the password text.
Agents: Enter the associated Unix/Windows agents. The agent name displays in the field after entering the name and typing a comma or by clicking the Tab or Enter key. You can enter more than one agent in the fields. Once the agent is specified, you can delete the agent by clicking the X next to their name.
- For TIBCO Hawk domains running on Rendezvous transports, specify the connection information and click SAVE where:
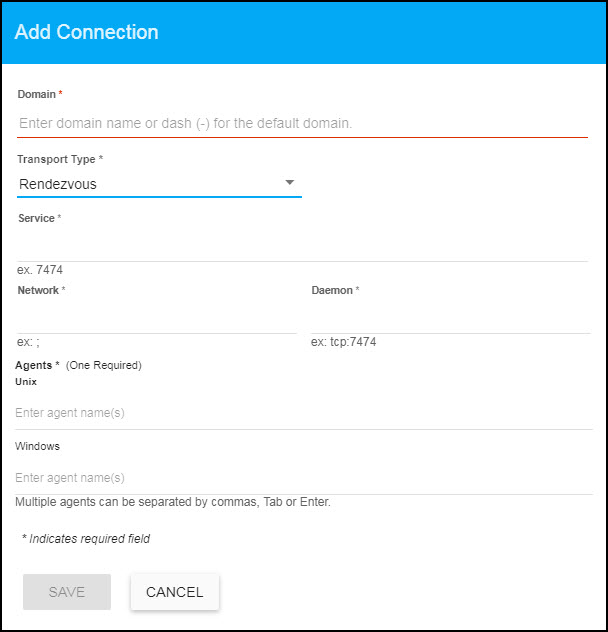
Domain: Enter the name of the domain.
Transport Type: Select Rendezvous from this drop down list.
Service: Enter the Service for the Rendezvous connection.
Network: Enter the Network for the Rendezvous connection.
Daemon: Enter the Daemon for the Rendezvous connection.
Agents: Enter the associated Unix/Windows agents. The agent name displays in the field after entering the name and typing a comma or by clicking the Tab or Enter key. You can enter more than one agent in the fields. Once the agent is specified, you can delete the agent by clicking the X next to their name.
- After you complete these configuration steps and start the RTView Data Server, you can verify your Hawk configuration by viewing the dataserver.log file, located in the logs directory. For example:
2013-05-08 13:39:48,009 INFO rtv_stdout - [rtview] ... AppMgr.initApp
2013-05-08 13:39:48,009 INFO rtv_stdout - [rtview] ... BWMON Manager AppMgr.initApp
2013-05-08 13:39:48,025 INFO rtv_stdout - [rtview] ... using filters file <bwmon_filters.xml>
2013-05-08 13:39:49,056 INFO rtv_stdout - [rtview] ... startApplication()
2013-05-08 13:39:49,056 INFO rtv_stdout - [rtview] ... startApplication()
2013-05-08 13:39:49,056 INFO rtv_stdout - [rtview] ----------------------------
2013-05-08 13:39:49,056 INFO rtv_stdout - [rtview] Group: WIN_AGENTS
2013-05-08 13:39:49,056 INFO rtv_stdout - [rtview] Agent: demo1(domain1)
2013-05-08 13:39:49,056 INFO rtv_stdout - [rtview] Agent: demo2(domain1)
2013-05-08 13:39:49,056 INFO rtv_stdout - [rtview] Agent: demo3(domain1)
2013-05-08 13:39:49,056 INFO rtv_stdout - [rtview] ----------------------------
2013-05-08 1339:49,056 INFO rtv_stdout - [rtview] ----------------------------
2013-05-08 13:39:49,056 INFO rtv_stdout - [rtview] Group: UNIX_AGENTS
2013-05-08 13:39:49,072 INFO rtv_stdout - [rtview] Agent: demo4(domain2)
2013-05-08 13:39:49,072 INFO rtv_stdout - [rtview] Agent: demo5(domain2)
2013-05-08 13:39:49,072 INFO rtv_stdout - [rtview] Agent: demo6(domain2)
2013-05-08 13:39:49,072 INFO rtv_stdout - [rtview] ----------------------------
Configuring Data Collection for RTView Manager
The configurations defined in this section are only relevant for Version 5 users, and only if they enabled JMX. Version 6 users do not need to complete this section. JMX data is available in the Monitor in the RTView Servers view.
- Navigate to the Solution Package Configuration > RTView Manager > CONNECTIONS tab.
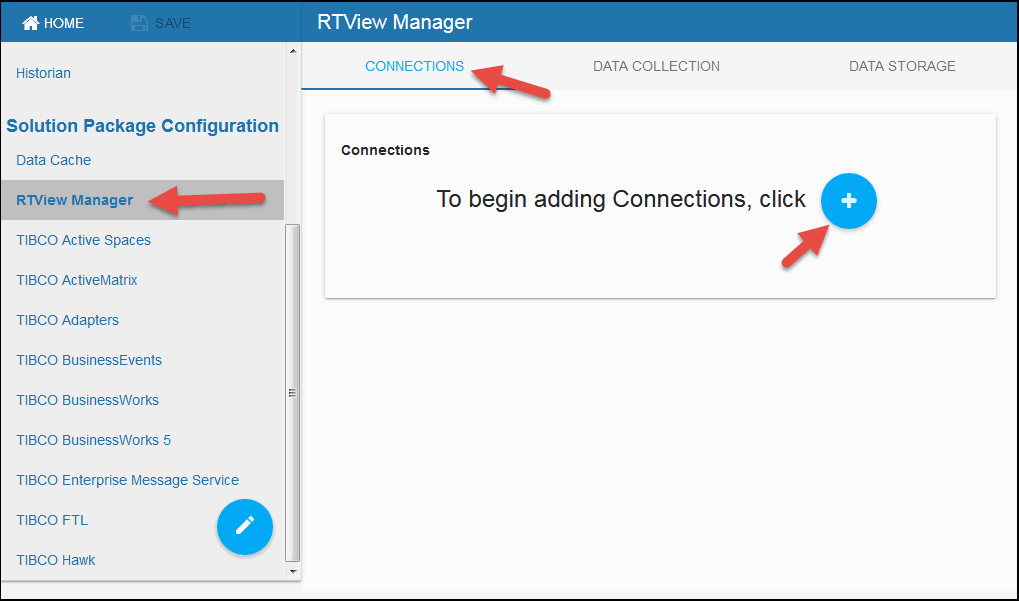
- Click the icon.
The Add Connection dialog displays.
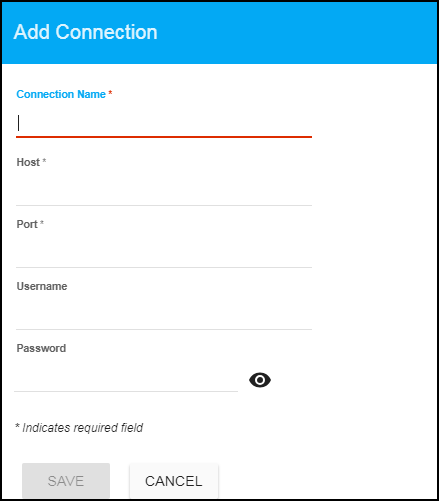
- Add a connection for each BusinessWorks engine for which you enabled monitoring via JMX. See “Enable Monitoring via JMX for Version 5” for more information.
Connection Name: Use the Engine name for the Connection Name field.
Host: Enter the host for the engine.
Port: Enter the Port specified in your .tra file.
Username: The username is used when creating the connection. This field is optional.
Password: This password is used when creating the connection. This field is optional. By default, the password entered is hidden. Click the icon to view the password text.
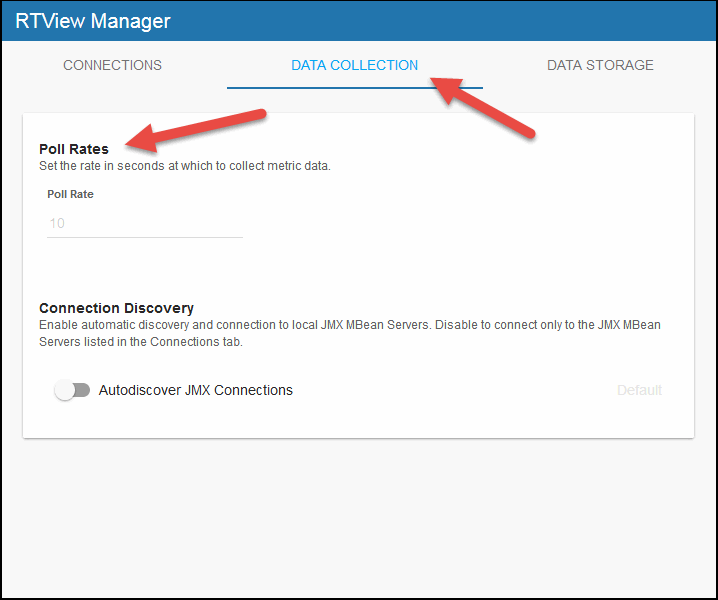
- Optionally, navigate to Solution Package Configuration > RTView Manager > DATA COLLECTION > Poll Rates to update the default polling rates for all RTView Manager caches.
Note: The Connection Discovery option does not impact TIBCO ActiveMatrix BusinessWorks.
Configuring Historical Data for RTView Manager (Optional)
You can specify the number of history rows to store in memory, the compaction rules, the duration before metrics are expired and deleted, and the different types of metrics that you want the Historian to store in the Data Storage tab in the RTView Configuration Application. These configurations already contain default values and modifications to these configurations are optional.
Defining the Storage of In Memory RTView Manager History
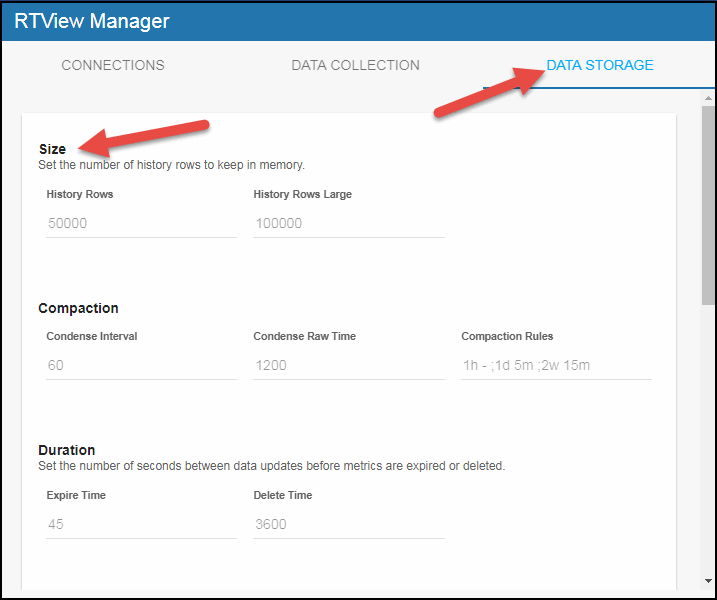
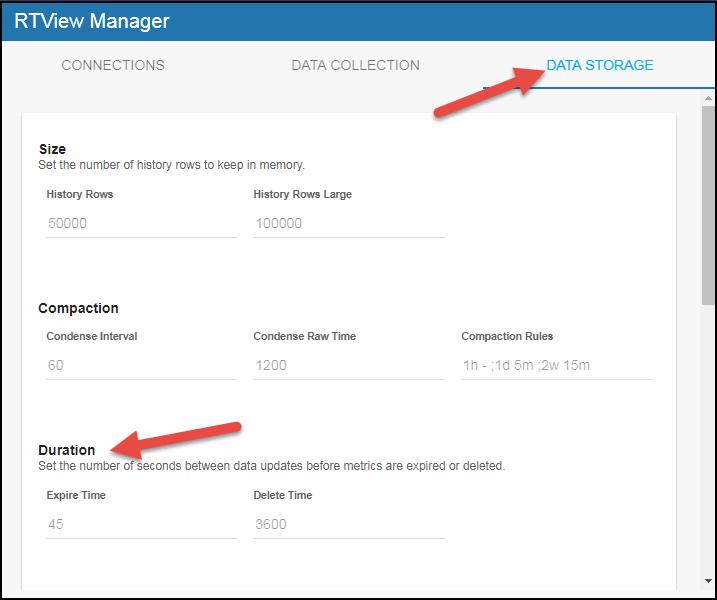
You can modify the maximum number of history rows to store in memory in the DATA STORAGE tab. The History Rows property defines the maximum number of rows to store for the JvmGcInfo, JvmMemoryPool, RtvDataServerManager, RtvDisplayServerManager, RtvDataServerClientTotals, TomcatGlobalRequestStats, and TomcatWebModuleTotals caches. The History Rows Large property defines the maximum number of rows to store for the JvmOperatingSystem, JvmThreading, JvmMemory, RtvDataServerClientStats, and TomcatWebModuleStats caches. The default setting for History Rows is 50,000 and the default setting for History Rows Large is 100,000. To update the default settings:
- Navigate to the Solution Package Configuration > RTView Manager > DATA STORAGE tab.
- In the Size region, click the History Rows and History Rows Large fields and specify the desired number of rows.
Defining Compaction Rules for RTView Manager
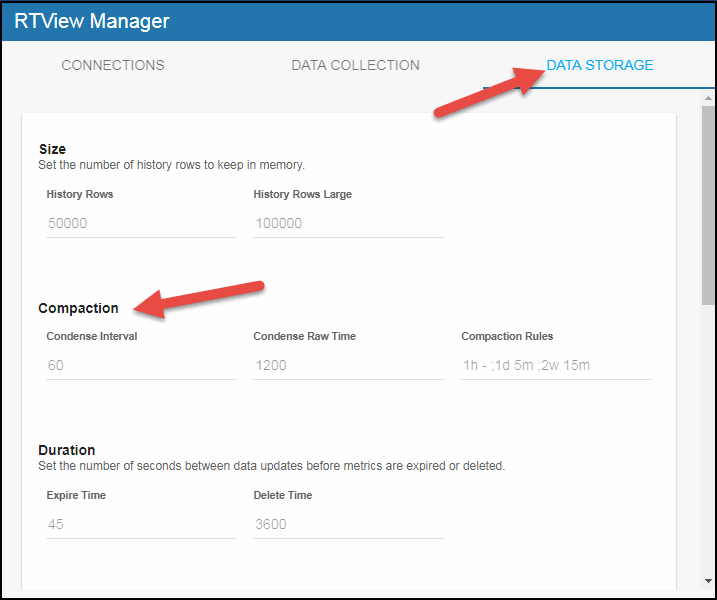
Data compaction, essentially, is taking large quantities of data and condensing it using a defined rule so that you store a reasonably sized sample of data instead of all of your data, thus preventing you from potentially overloading your database. The available fields are:
Condense Interval -- The time interval at which the cache history is condensed. The default is 60 seconds. The following caches are impacted by this setting: JvmGcInfo, JvmMemoryPool, JvmOperatingSystem, JvmThreading, JvmMemory, RtvDataServerManager, and RtvDataServerClientTotals.
Condense Raw Time -- The time span of raw data kept in the cache history table. The default is 1200 seconds. The following caches are impacted by this setting: JvmGcInfo, JvmMemoryPool, JvmOperatingSystem, JvmThreading, JvmMemory, RtvDataServerManager, RtvDataServerClientTotals, TomcatWebModuleStats, TomcatGlobalRequestStats, and TomcatWebModuleTotals.
Compaction Rules -- This field defines the rules used to condense your historical data in the database. By default, the columns kept in history will be aggregated by averaging rows with the following rule 1h -;1d 5m;2w 15m, which means the data from 1 hour will not be aggregated (1h - rule), the data over a period of 1 day will be aggregated every 5 minutes (1d 5m rule), and the data over a period of 2 weeks old will be aggregated every 15 minutes (2w 15m rule). The following caches are impacted by this setting: JvmOperatingSystem, JvmThreading, JvmMemory, RtvDataServerManager, RtvDataServerClientTotals, TomcatWebModuleStats, TomcatGlobalRequestStats, and TomcatWebModuleTotals.
- Navigate to the Solution Package Configuration > RTView Manager > DATA STORAGE tab.
- In the Compaction region, click the Condense Interval, Condense Raw Time, and Compaction Rules fields and specify the desired settings.
Defining Expiration and Deletion Duration for RTView Manager Metrics
The data for each metric is stored in a specific cache and, when the data is not updated in a certain period of time, that data will either be marked as expired or, if it has been an extended period of time, it will be deleted from the cache altogether.
The Expire Time field, which sets the expire time for the JvmConnections, JvmGcInfo, JvmMemoryPool, JvmClassLoading, JvmCompilation, JvmOperatingSystem, JvmThreading, JvmMemory, JvmMemoryManager, JvmSystemProperties, RtvDataServerManager, RtvDisplayServerManager, RtvHistorianManager, RtvDataServerClientStats, RtvDataServerClientTotals, RtvServerVersion, TomcatWebModuleStats, TomcatConnectorInfo, TomcatGlobalRequestStats, TomcatHostInfo, and TomcatWebModuleTotals caches, defaults to 45 seconds.
The Delete Time field, which sets the delete time for the JvmConnections, JvmGcInfo, JvmMemoryPool, JvmClassLoading, JvmCompilation, JvmOperatingSystem, JvmRuntime, JvmThreading, JvmMemory, JvmMemoryManager, JvmSystemProperties, RtvDataServerManager, RtvDisplayServerManager, TomcatWebModuleStats, TomcatGlobalRequestStats, TomcatWebModuleTotals, RtvHistorianManager, RtvDataServerClientStats, RtvDataServerClientTotals, RtvServerVersion, TomcatWebModuleStats, TomcatConnectorInfo, TomcatGlobalRequestStats, TomcatHostInfo, and TomcatWebModuleTotals caches, defaults to 3600 seconds. To modify these defaults:
- Navigate to the Solution Package Configuration > RTView Manager > DATA STORAGE tab.
- In the Duration region, click the Expire Time and Delete Time fields and specify the desired settings.
Enabling/Disabling Storage of Historical Data for RTView Manager
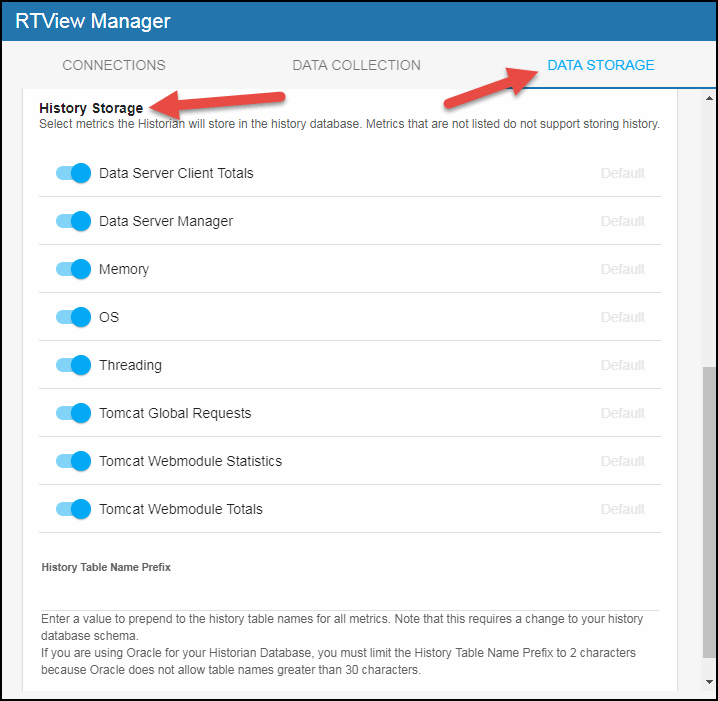
The History Storage region allows you to select which metrics you want the Historian to store in the history database. By default, all RTView Manager historical data is saved to the database. To enable/disable the collection of historical data, perform the following steps:
- Navigate to the Solution Package Configuration > RTView Manager > DATA STORAGE tab.
- In the History Storage region, select the toggles for the various metrics that you want to collect/deselect for the metrics that you do not want to collect. Blue is enabled, gray is disabled.
Defining a Prefix for All History Table Names for RTView Manager Metrics
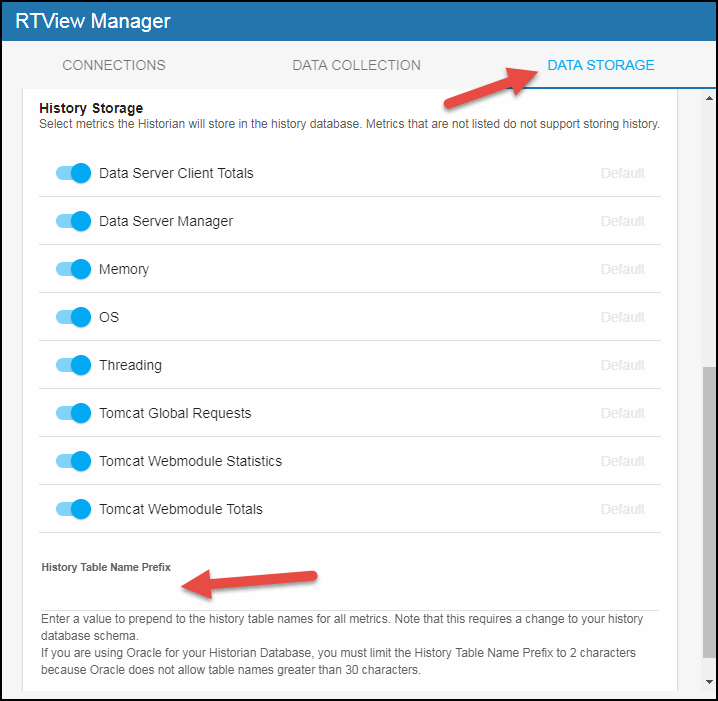
The History Table Name Prefix field allows you to define a prefix that will be added to the database table names so that the Monitor can differentiate history data between data servers when you have multiple data servers with corresponding Historians using the same solution package(s) and database. In this case, each Historian needs to save to a different table, otherwise the corresponding data server will load metrics from both Historians on startup. Once you have defined the History Table Name Prefix, you will need to create the corresponding tables in your database as follows:
- Locate the .sql template for your database under RTVAPM_HOME/rtvmgr/dbconfig and make a copy of it
- Add the value you entered for the History Table Name Prefix to the beginning of all table names in the copied .sql template
- Use the copied .sql template to create the tables in your database
Note: If you are using Oracle for your Historian Database, you must limit the History Table Name Prefix to 2 characters because Oracle does not allow table names greater than 30 characters (and the longest table name for the solution package is 28 characters).
To add the prefix:
- Navigate to the Solution Package Configuration > RTView Manager > DATA STORAGE tab.
- Click on the History Table Name Prefix field and enter the desired prefix name.
Configuring Data Collection for TIBCO BusinessWorks Version 6 (Optional)
Connections for TIBCO BusinessWorks are created in TIBCO Hawk and RTView Manager (for Version 5). See Enable Monitoring via TIBCO Hawk for Versions 5 and 6 and Configuring Data Collection for RTView Manager for more information. This section describes how to modify the default values for the data collection properties in the DATA COLLECTION tab for TIBCO BusinessWorks Version 6.
- Navigate to the Solution Package Configuration > TIBCO BusinessWorks > DATA COLLECTION tab.
- By default, collecting activities data for TIBCO Businessworks is disabled. To enable collecting activities (Bw6Activities cache) data, navigate to the Solution Package Configuration > TIBCO BusinessWorks > DATA COLLECTION tab > Metric Selection section and enable the Activities toggle. Grey toggle is disabled, blue toggle is enabled.
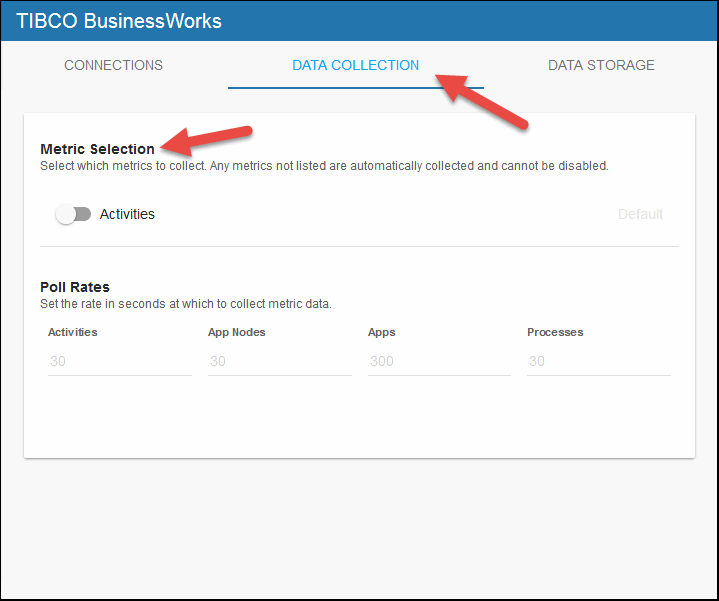
- If you want to modify the default values for the update rates for the TIBCO BusinessWorks caches, you can update the default polling rates in the Solution Package Configuration > TIBCO BusinessWorks > DATA COLLECTION > Poll Rates region.
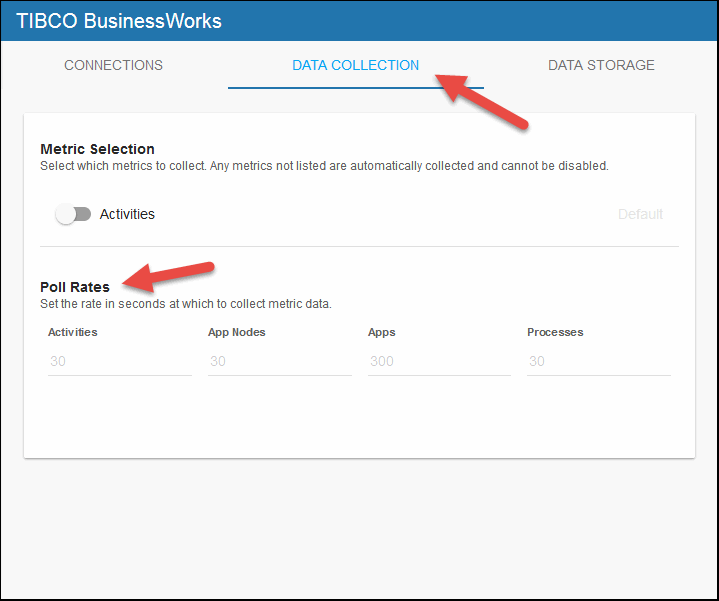
- Modify the value for the Activities field to modify the default polling rate for the _Bw6HawkActivityStatistics, _Bw6Activities, Bw6Activities, and Bw6ActivityTotalsByProcess caches. Modify the value for the App Nodes field to modify the polling rate for the _Bw6HawkAppNodeProcessInfo, and _Bw6AppNodes caches. Modify the value for the Apps field to modify the polling rate for the _Bw6HawkApps, Bw6AppSlices, __Bw6Apps, _Bw6Apps, _Bw6AppsDelta, and Bw6Apps caches. Modify the value for the Processes field to modify the polling rate for the _Bw6HawkProcessStatistics, _Bw6Processes, Bw6Processes, Bw6ProcessTotalsByAppNodeAndApp, Bw6ProcessTotalsByAppNode, Bw6ProcessTotalsByApp caches.
Configuring Historical Data for TIBCO BusinessWorks Version 6 (Optional)
This section describes how to modify the default values for the the number of history rows to store in memory, the compaction rules, the duration before metrics are expired and deleted, and the different types of metrics that you want the Historian to store in the DATA STORAGE tab in the RTView Configuration Application. This section is optional.
Defining the Storage of In Memory BWMON History
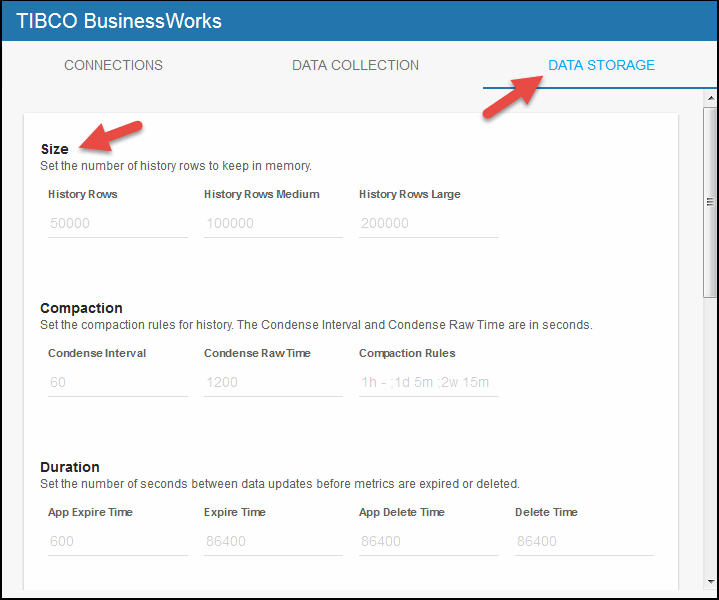
You can modify the maximum number of history rows to store in memory in the DATA STORAGE tab. The History Rows property defines the maximum number of rows to store for the Bw6AppNodes, Bw6ProcessTotalsByAppNode, Bw6ProcessTotalsByApp, and Bw6ProcessTotalsByAppNodeAndApp caches. The History Rows Medium property defines the maximum number of rows to store for the Bw6ActivityTotalsByProcess and Bw6Processes caches. The History Rows Large property defines the maximum number of rows to store for the Bw6Activities cache. The default setting for History Rows is 50,000, the default setting for History Rows Medium is 100,000, and the default setting for History Rows Large is 200,000. To update the default settings:
- Navigate to the Solution Package Configuration > TIBCO Businessworks > DATA STORAGE tab.
- In the Size region, click the History Rows, History Rows Medium, and History Rows Large fields and specify the desired number of rows.
Defining Compaction Rules for BWMON
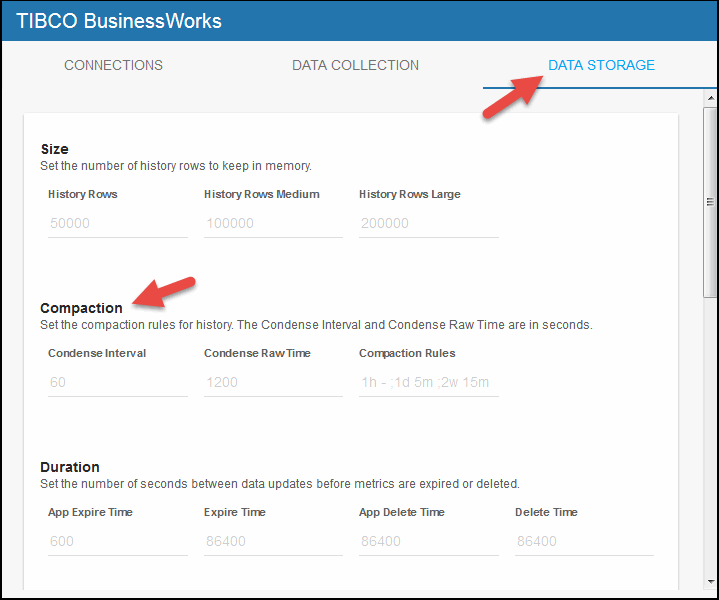
Data compaction, essentially, is taking large quantities of data and condensing it using a defined rule so that you store a reasonably sized sample of data instead of all of your data, thus preventing you from potentially overloading your database. The available fields are:
Condense Interval -- The time interval at which the cache history is condensed. The default is 60 seconds. The following caches are impacted by this setting: Bw6Activities, Bw6ActivityTotalsByProcess, Bw6AppNodes, Bw6Processes, Bw6ProcessTotalsByAppNode, Bw6ProcessTotalsByApp, and Bw6ProcessTotalsByAppNodeAndApp.
Condense Raw Time -- The time span of raw data kept in the cache history table. The default is 1200 seconds. The following caches are impacted by this setting: Bw6Activities, Bw6ActivityTotalsByProcess, Bw6AppNodes, Bw6Processes, Bw6ProcessTotalsByAppNode, Bw6ProcessTotalsByApp, and Bw6ProcessTotalsByAppNodeAndApp.
Compaction Rules -- This field defines the rules used to condense your historical data in the database. By default, the columns kept in history will be aggregated by averaging rows with the following rule 1h -;1d 5m;2w 15m, which means the data from 1 hour will not be aggregated (1h - rule), the data over a period of 1 day will be aggregated every 5 minutes (1d 5m rule), and the data over a period of 2 weeks old will be aggregated every 15 minutes (2w 15m rule). The following caches are impacted by this setting: Bw6Activities, Bw6ActivityTotalsByProcess, Bw6AppNodes, Bw6Processes, Bw6ProcessTotalsByAppNode, Bw6ProcessTotalsByApp, and Bw6ProcessTotalsByAppNodeAndApp.
- Navigate to the Solution Package Configuration > TIBCO Businessworks > DATA STORAGE tab.
- In the Compaction region, click the Condense Interval, Condense Raw Time, and Compaction Rules fields and specify the desired settings.
Defining Expiration and Deletion Duration for BWMON Metrics
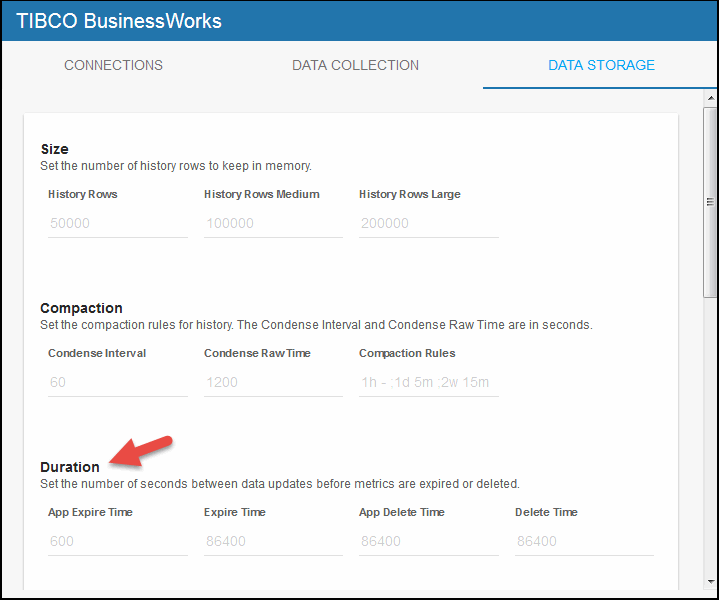
The data for each metric is stored in a specific cache and, when the data is not updated in a certain period of time, that data will either be marked as expired or, if it has been an extended period of time, it will be deleted from the cache altogether. The App Expire Time field, which sets the expire time for the Bw6Apps cache, defaults to 600 seconds. The Expire Time field, which sets the expire time for the Bw6Activities, Bw6AppSlices, Bw6OsgiAgents, and Bw6Processes caches, defaults to 75 seconds. The App Delete Time field, which sets the delete time for the Bw6Apps cache, defaults to 86,400 seconds. The Delete Time field, which sets the delete time for the Bw6Activities, Bw6AppSlices, Bw6AppNodes, Bw6AppNodes, Bw6OsgiAgents, and Bw6Processes caches, defaults to 3600 seconds. To modify these defaults:
- Navigate to the Solution Package Configuration > TIBCO Businessworks > DATA STORAGE tab.
- In the Duration region, click the App Expire Time, Expire Time, App Delete Time, and Delete Time fields and specify the desired settings.
Enabling/Disabling Storage of BWMON Historical Data
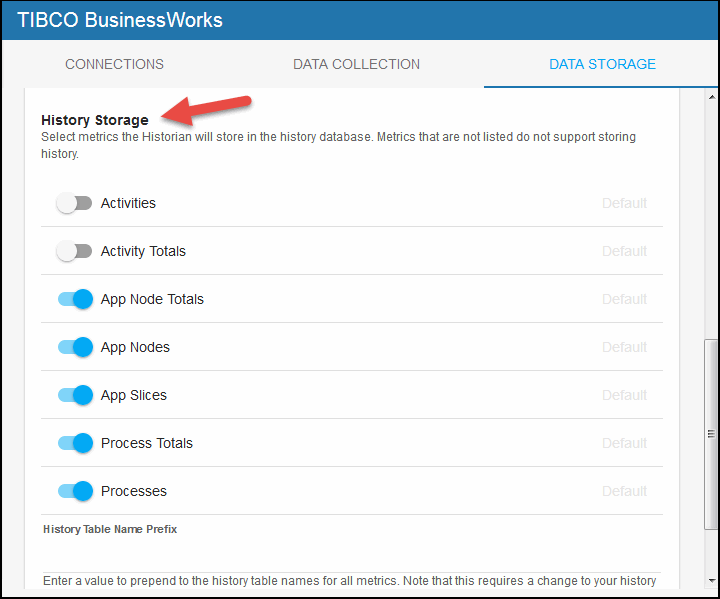
The History Storage region allows you to select which metrics you want the Historian to store in the history database. By default, historical Activities and Activity Totals data is not saved to the database. All other metrics are saved by default. To enable/disable the collection of historical data, perform the following steps:
- Navigate to the Solution Package Configuration > TIBCO Businessworks > DATA STORAGE tab.
- In the History Storage region, select the toggles for the various metrics that you want to collect/deselect for the metrics that you do not want to collect. Blue is enabled, gray is disabled.
Defining a Prefix for All History Table Names for Metrics
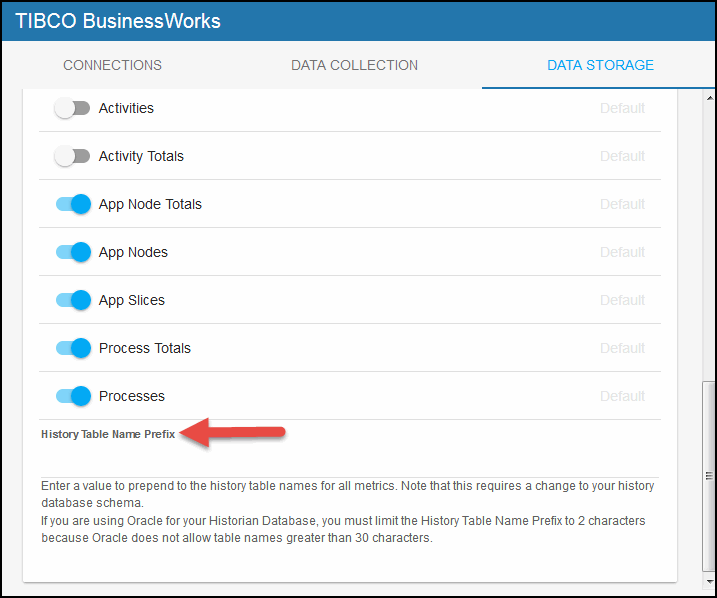
The History Table Name Prefix field allows you to define a prefix that will be added to the database table names so that the Monitor can differentiate history data between data servers when you have multiple data servers with corresponding Historians using the same solution package(s) and database. In this case, each Historian needs to save to a different table, otherwise the corresponding data server will load metrics from both Historians on startup. Once you have defined the History Table Name Prefix, you will need to create the corresponding tables in your database as follows:
- Locate the .sql template for your database under RTVAPM_HOME/bw6mon/dbconfig and make a copy of it
- Add the value you entered for the History Table Name Prefix to the beginning of all table names in the copied .sql template
- Use the copied .sql template to create the tables in your database
Note: If you are using Oracle for your Historian Database, you must limit the History Table Name Prefix to 2 characters because Oracle does not allow table names greater than 30 characters (and the longest table name for the solution package is 28 characters).
To add the prefix:
- Navigate to the Solution Package Configuration > TIBCO Businessworks > DATA STORAGE tab.
- Click on the History Table Name Prefix field and enter the desired prefix name.
Configuring Data Collection for TIBCO BusinessWorks Version 5 (Optional)
Connections for TIBCO BusinessWorks are created in TIBCO Hawk and RTView Manager (for Version 5). See Enable Monitoring via TIBCO Hawk for Versions 5 and 6 and Configuring Data Collection for RTView Manager for more information. This section describes how to modify the default values for the data collection properties in the DATA COLLECTION tab for TIBCO BusinessWorks Version 5.
- Navigate to the Solution Package Configuration > TIBCO Businessworks 5 > DATA COLLECTION tab.
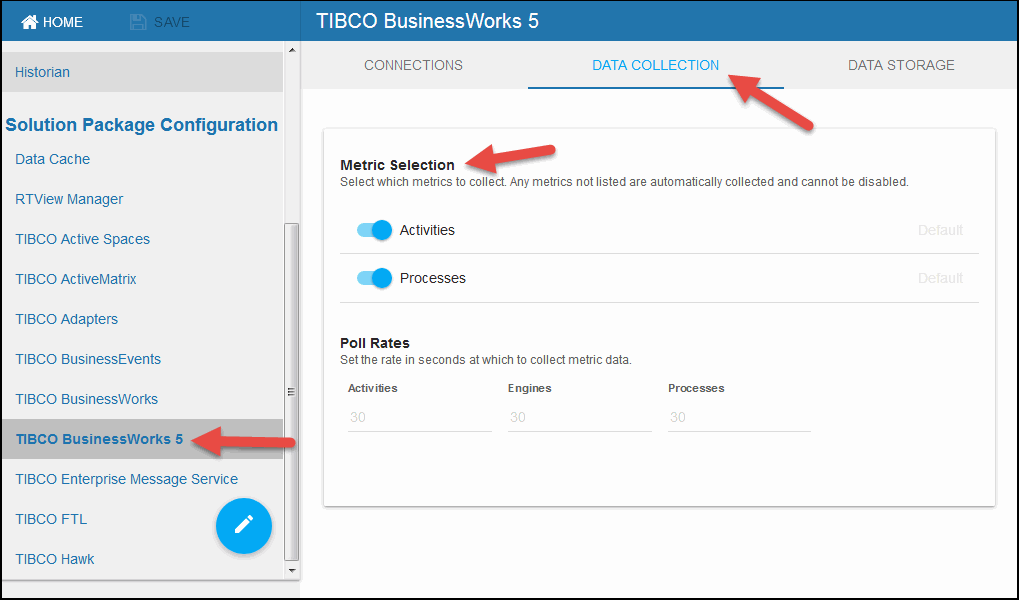
- By default, collecting activities and processes data for TIBCO Businessworks 5 is enabled. To disable collecting activities (BwActivities cache) and processes (BwProcesses cache) data, navigate to the TIBCO Businessworks 5 > DATA COLLECTION tab > Metric Selection section and disable the Activities and Processes toggles. Grey toggle is disabled, blue toggle is enabled.
- If you want to modify the default values for the update rates for the TIBCO Businessworks 5 caches, you can update the default polling rates in Solution Package Configuration > TIBCO Businessworks 5 > DATA COLLECTION > Poll Rates.
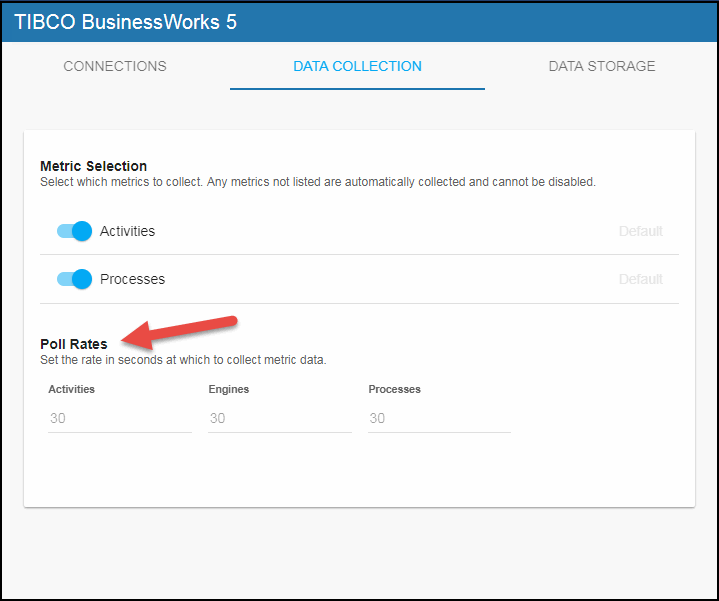
- Modify the value for the Activities field to modify the default polling rate for the BwActivities and BwActivityTotalsByProcess caches, which will update at approximately this rate, but will get occasional extra updates. Modify the value for the Engines field to modify the polling rate for the BwUndeployedEngines, BwEngines, BwEnginesDeployment, BwEngineState caches, which will update at approximately this rate, but will get occasional extra updates. Modify the value for the Processes field to modify the polling rate for the BwProcess and BwProcessTotalsByEngine caches, which will update at approximately this rate, but will get occasional extra updates.
Configuring Historical Data for TIBCO BusinessWorks Version 5 (Optional)
This section describes how to modify the default values for the the number of history rows to store in memory, the compaction rules, the duration before metrics are expired and deleted, and the different types of metrics that you want the Historian to store in the DATA STORAGE tab in the RTView Configuration Application. This section is optional.
Defining the Storage of In Memory BWMON5 History
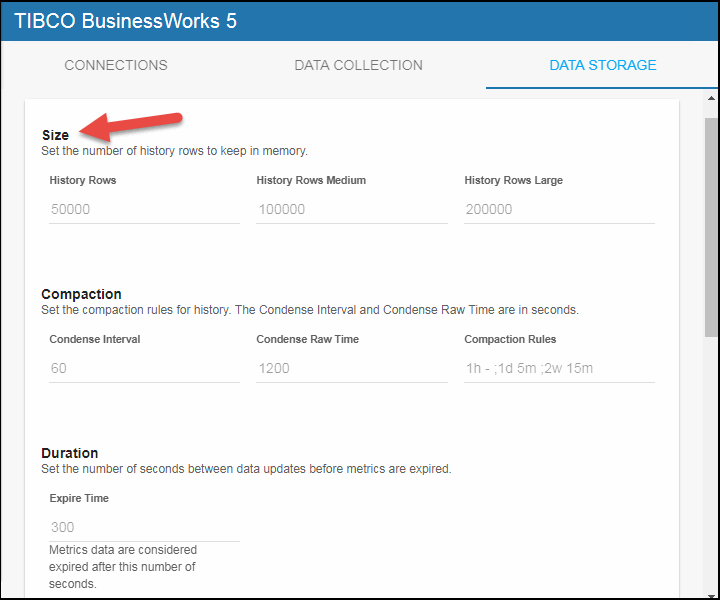
You can modify the maximum number of history rows to store in memory in the DATA STORAGE tab. The History Rows property defines the maximum number of rows to store for the BwEngines, BwProcessTotalsByEngine, and BwServers caches. The History Rows Medium property defines the maximum number of rows to store for the BwActivityTotalsByProcess and BwProcesses caches. The History Rows Large property defines the maximum number of rows to store for the BwActivities cache. The default setting for History Rows is 50,000, the default setting for History Rows Medium is 100,000, and the default setting for History Rows Large is 200,000. To update the default settings:
- Navigate to the Solution Package Configuration > TIBCO Businessworks 5 > DATA STORAGE tab.
- In the Size region, click the History Rows, History Rows Medium, and History Rows Large fields and specify the desired number of rows.
Defining Compaction Rules for BWMON5
Data compaction, essentially, is taking large quantities of data and condensing it using a defined rule so that you store a reasonably sized sample of data instead of all of your data, thus preventing you from potentially overloading your database. The available fields are:
Condense Interval -- The time interval at which the cache history is condensed. The default is 60 seconds. The following caches are impacted by this setting: BwActivities, BwActivityTotalsByProcess, BwEngines, BwProcesses, BwProcessTotalsByEngine, and BwServers.
Condense Raw Time -- The time span of raw data kept in the cache history table. The default is 1200 seconds. The following caches are impacted by this setting: BwActivities, BwActivityTotalsByProcess, BwEngines, BwProcesses, and BwProcessTotalsByEngine.
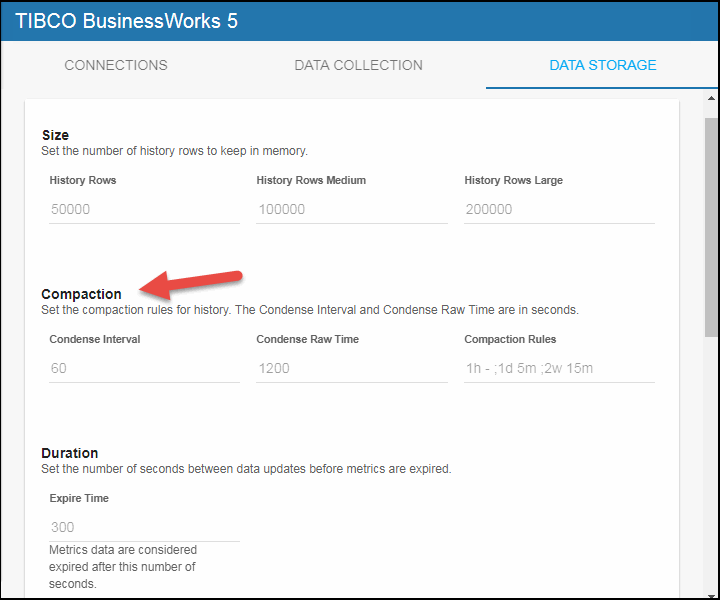
Compaction Rules -- This field defines the rules used to condense your historical data in the database. By default, the columns kept in history will be aggregated by averaging rows with the following rule 1h -;1d 5m;2w 15m, which means the data from 1 hour will not be aggregated (1h - rule), the data over a period of 1 day will be aggregated every 5 minutes (1d 5m rule), and the data over a period of 2 weeks old will be aggregated every 15 minutes (2w 15m rule). The following caches are impacted by this setting: BwActivities, BwActivityTotalsByProcess, BwEngines, BwProcesses, BwProcessTotalsByEngine, and BwServers.
- Navigate to the Solution Package Configuration > TIBCO Businessworks 5 > DATA STORAGE tab.
- In the Compaction region, click the Condense Interval, Condense Raw Time, and Compaction Rules fields and specify the desired settings.
Defining Expiration and Deletion Duration for BWMON5 Metrics
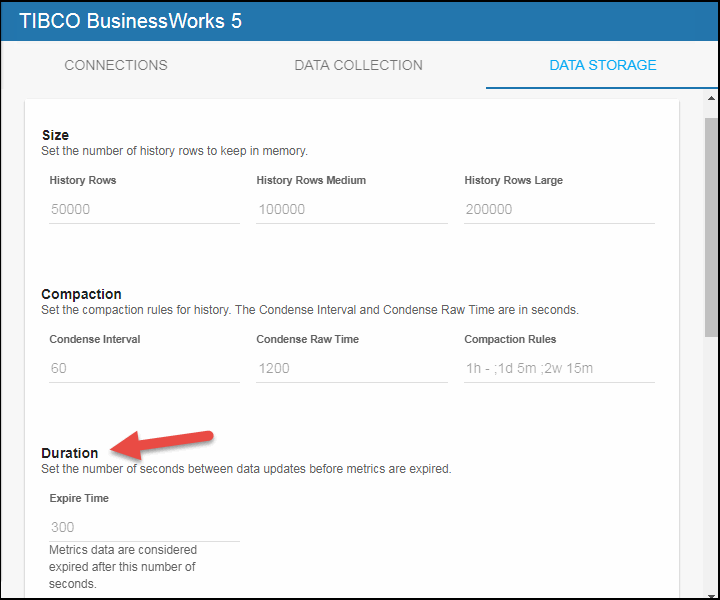
The data for each metric is stored in a specific cache and, when the data is not updated in a certain period of time, that data will be marked as expired. The Expire Time field, which sets the expire time for the BwServers cache, defaults to 300 seconds. To modify this default:
- Navigate to the Solution Package Configuration > TIBCO Businessworks 5 > DATA STORAGE tab.
- In the Duration region, click the Expire Time field and specify the desired settings.
Enabling/Disabling Storage of Historical Data for BWMON5
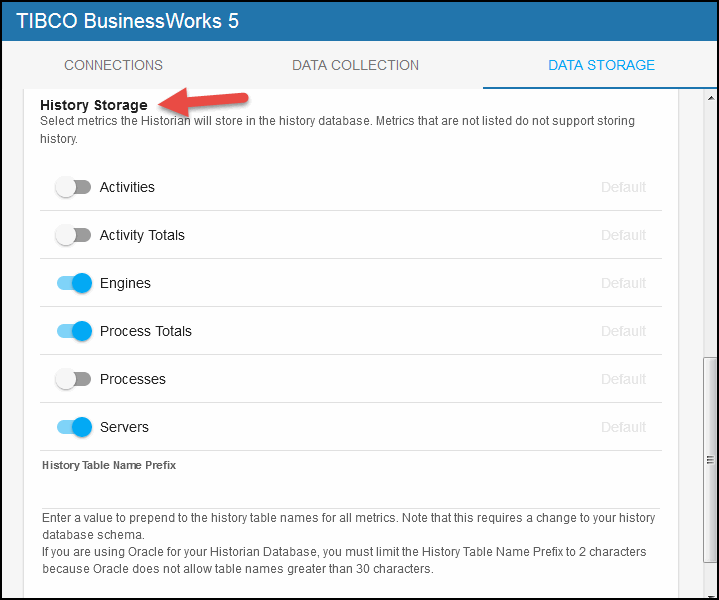
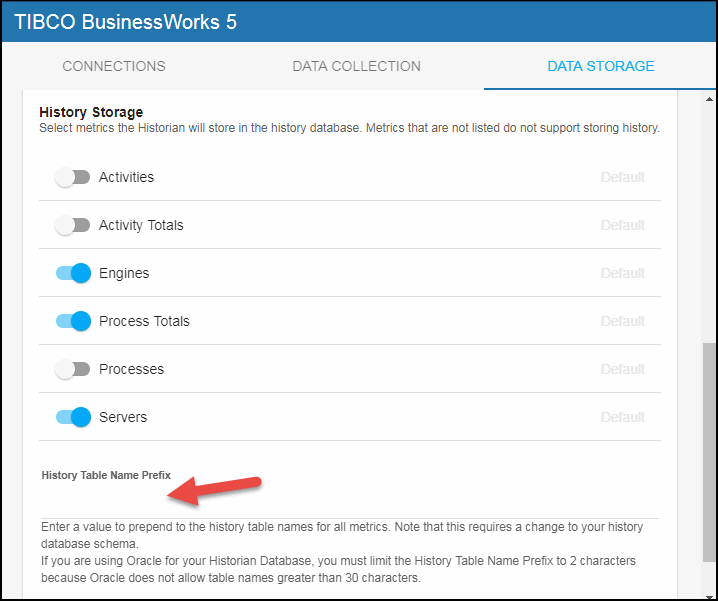
The History Storage region allows you to select which metrics you want the Historian to store in the history database. By default, historical Activities, Activity Totals, and Processes data is not saved to the database. All other metrics are saved by default. To enable/disable the collection of historical data, perform the following steps:
- Navigate to the Solution Package Configuration > TIBCO Businessworks 5 > DATA STORAGE tab.
- In the History Storage region, select the toggles for the various metrics that you want to collect/deselect for the metrics that you do not want to collect. Blue is enabled, gray is disabled.
Defining a Prefix for All History Table Names for BWMON5 Metrics
The History Table Name Prefix field allows you to define a prefix that will be added to the database table names so that the Monitor can differentiate history data between data servers when you have multiple data servers with corresponding Historians using the same solution package(s) and database. In this case, each Historian needs to save to a different table, otherwise the corresponding data server will load metrics from both Historians on startup. Once you have defined the History Table Name Prefix, you will need to create the corresponding tables in your database as follows:
- Locate the .sql template for your database under RTVAPM_HOME/bwmon/dbconfig and make a copy of it
- Add the value you entered for the History Table Name Prefix to the beginning of all table names in the copied .sql template
- Use the copied .sql template to create the tables in your database
Note: If you are using Oracle for your Historian Database, you must limit the History Table Name Prefix to 2 characters because Oracle does not allow table names greater than 30 characters (and the longest table name for the solution package is 28 characters).
To add the prefix:
- Navigate to the Solution Package Configuration > TIBCO Businessworks 5 > DATA STORAGE tab.
- Click on the History Table Name Prefix field and enter the desired prefix name.
Configure for BWSE Engines for Version 5
This section is for TIBCO ActiveMatrix (AMX) users, and describes how to configure BW Monitor to monitor BWSE engines. BW Monitor needs access to AMX Node data stored in EMS message queues on the AMX Host system. To make this data available to BW Monitor you will create EMS topics with bridges from the queues.
The TIBCO BusinessWorks Service Engine (BWSE) is an ActiveMatrix (AMX) component that enables BW engines to participate in the implementation of AMX services. In this case, the BWSE engines run within an AMX Node and are not visible to BW Monitor. However, you can configure BW Monitor to display these engines, as well as to gather JVM memory metrics for the AMX Nodes in which they are running.
To Configure for BWSE engines:
- Navigate to the Server Configuration > General > CUSTOM PROPERTIES tab.
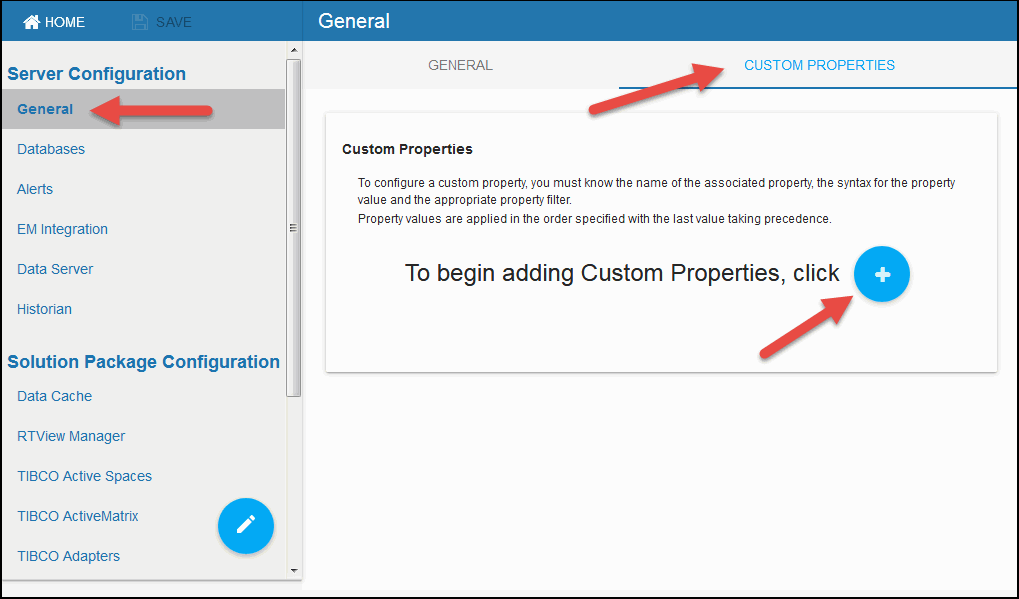
- Click the icon.
The Add Property dialog displays.
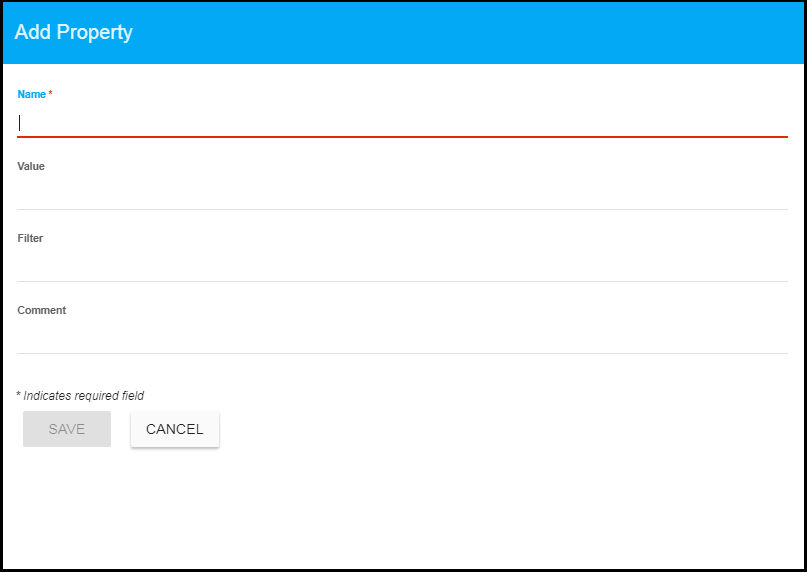
- Create the following custom properties, one at a time, and click SAVE after creating each:
Name: sl.rtview.cache.config
Value: bw_engine_microagents.rtv
Filter: collector
Name: sl.rtview.cache.config
Value: bw_amx_node_cache.rtv
Filter: collector
Name: sl.rtview.sub
Value: $AMX3.x_STATS_TOPIC:rtv.amx.governance.stats
Filter: collector
Once all three are created and saved, the newly created properties display in the Custom Properties tab.
- For each AMX host, click the icon, add the following custom properties, and click SAVE after entering each:
Name: sl.rtview.jms.jmsconn
Value: local com.tibco.tibjms.TibjmsTopicConnectionFactory tcp://localhost:7222 admin - - - - -
Filter: collector
(where local is the connection name and tcp://localhost:7222 is the URL for your ems server)
Name: sl.rtview.cache.config
Value: bw_amx_node_cache_source.rtv $jms_conn:local
Filter: collector
(where local is the connection name)
Name: sl.rtview.jms.jmstopic
Value: local $AMX3.x_STATS_TOPIC
Filter: collector
(where local is the connection name)
Once all three are created and saved, the newly created properties display in the Custom Properties tab.
Reduce Collection of Process Data for Version 5
This section describes how to exclude BW5 process data that is collected by the Monitor but not of interest to you. By default, all process data is included. Excluding data stops it from being stored in the cache and removes it from displays. To exclude (or include) data, create a custom property in the RTView Configuration Application as such:
- Navigate to the Server Configuration > General > CUSTOM PROPERTIES tab.
- Click the icon.
The Add Property dialog displays.
- Define the values for the desired property. Each property specifies a regular expression that is applied to a process name. If the name matches the pattern, then the process is included. To exclude processes, start the filter pattern with ^ (negation).
For example, if you have the following processes:
process01.process
process02.process
process03.process
process04.process
process05.process
process06.process
process07.process
and you set the first property as follows:
Name: sl.rtview.sub
Value: $bwprocessFilterPattern:'0[3-5]'
Filter: collector
Comment: (description of the filter)
then the data for process03 to process05 is stored and displayed:
process03.process
process04.process
process05.process
If you set the second property as follows:
Name: sl.rtview.sub
Value: $bwprocessFilterPattern:'0[^4]'
Filter: collector
Comment: (description of the filter)
Then data from process04 is excluded and you continue getting data from:
process03.process
process05.process