Configuring TIBCO Enterprise Message Service for DataCollector, Version 5.1.1
This section describes how to collect data from the EMS Servers you want to monitor. This part of the EMS Monitor configuration is required. By default, the EMS Servers that are routed to by the EMS Servers defined in the RTView Configuration Application are auto-discovered and subsequently monitored. These instructions give you the option to turn off auto-discovery, which is on by default.
Configuring Data Collection
- Navigate to the Solution Package Configuration > TIBCO Enterprise Message Service > CONNECTIONS tab.
- On the CONNECTIONS tab, provide the correct full path to the directory containing the TIBCO Enterprise Message Service jar files in the Classpath field.
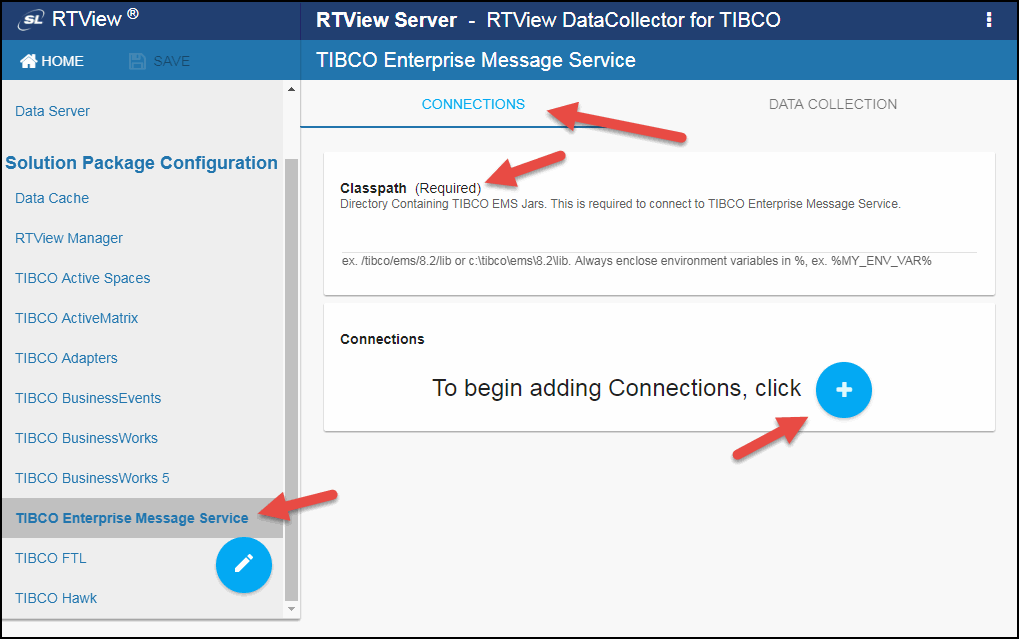
- Click the
 icon.
icon.
The Add Connection dialog displays.
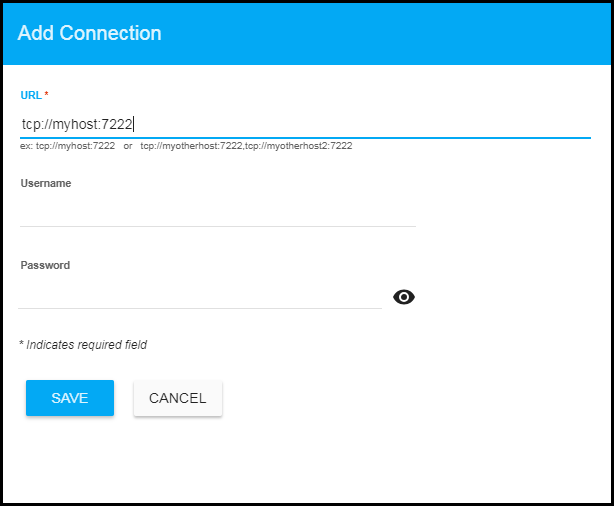
- Specify the connection information and click SAVE where:
URL: Enter the complete URL for the EMS Server. A comma-separated list of URLs is used to designate fault tolerant server pairs.
Username: The username is used when creating the connection to the EMS Server. This field is optional.
Password: This password is used when creating the connection to the EMS Server. This field is optional. By default, the password entered is hidden. Click the icon to view the password text.
- Repeat the last two steps for each EMS Server to be monitored.
Note: By default, servers that are routed to by the servers defined in this file are automatically discovered (you have the option to turn off auto-discovery in subsequent steps).
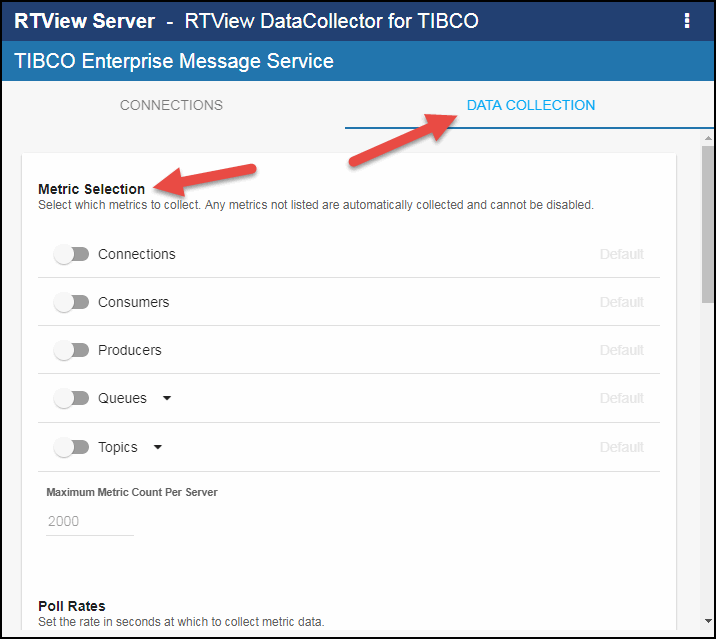
- By default, collecting connections, producers, consumers, queues, and topics data is disabled. To enable collecting connections, producers, consumers, queues, and topics data, navigate to the Solution Package Configuration > TIBCO Enterprise Message Service > DATA COLLECTION tab > Metric Selection section and enable the metrics for which you want to collect data.
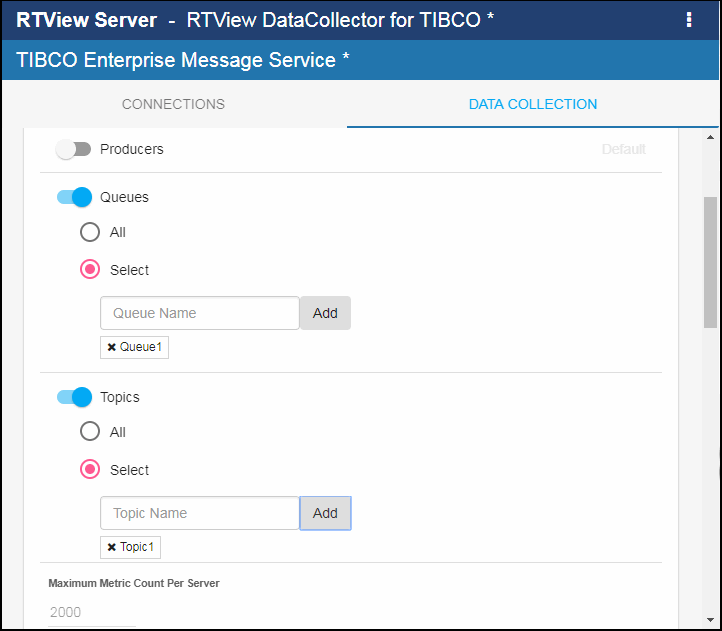
- When enabling topics and queues, if you want to limit specific topics and queues monitored (rather than monitoring all topics and queues for all defined and auto-discovered servers), click the Select option, specify the queues and topics that you want to monitor in the associated text entry box, and click Add. Repeat the process for each queue/topic you want to monitor.
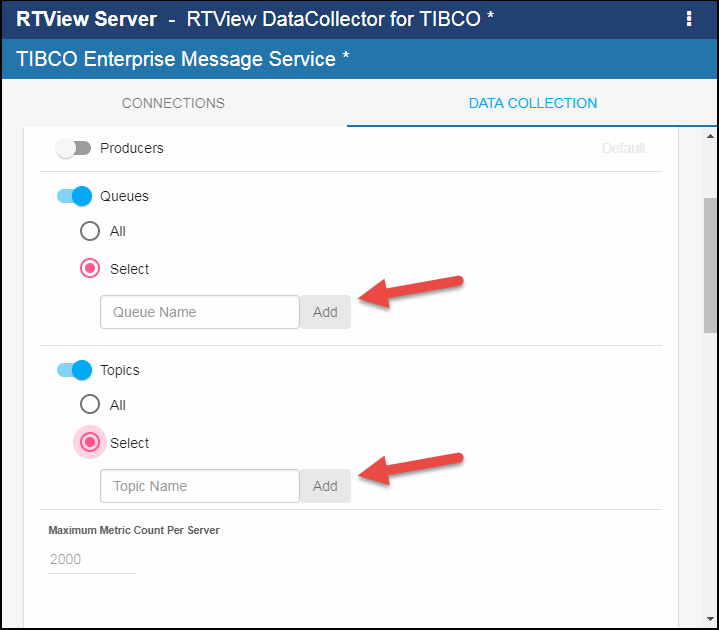
Newly added queues and topics are listed beneath the text entry field. Click the x next to the queue/topic to remove the queue/topic.
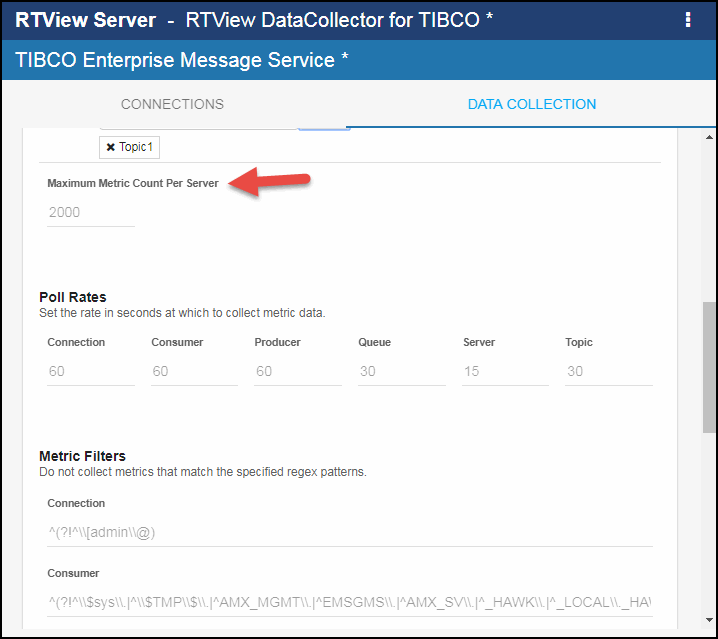
- Enabling EMS Queues and EMS Topics might cause performance issues due to the potentially large number of associated destinations, hence, the collection of metric data has been limited to 2000 rows per Data Server by default. To modify this limit, click the Maximum Metric Count Per Server field and enter the desired limit.
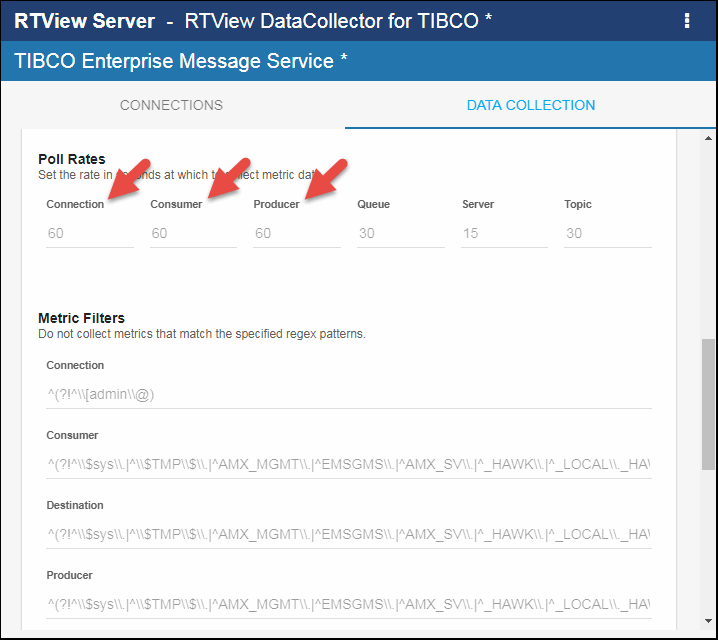
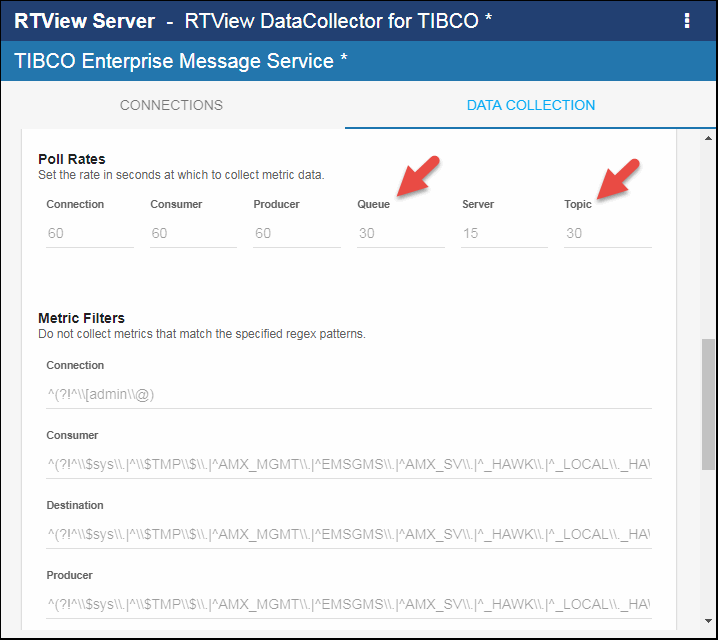
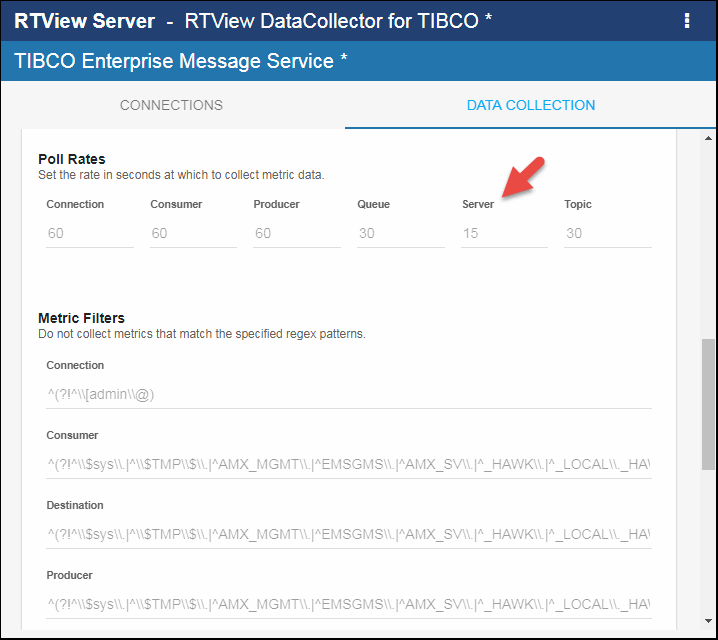
- If you want to modify the default values for the update rates for various server-related caches, you can update the default polling rates in Solution Package Configuration > TIBCO Enterprise Message Service > DATA COLLECTION > Poll Rates.
Connection, Consumer, and Producer Caches
Update the polling rates for the Connection, Producer, and Consumer fields to modify the default polling values for the EmsProducers, EmsConsumers, and EmsConnections caches:
Queues and Topics Caches
Update the polling rate for the Queue and Topic fields to modify the default polling rates for the EmsQueues and EmsTopics caches:
Server-Related Caches
Update the polling rate for the Server field to modify the default polling rate for the EmsServerInfo, EmsAdmStats, EmsBridges, EmsDurables, EmsRoutes, EmsFTServerTable, EmsListenPorts, EmsServerRouteTable, EmsServerTable, EmsUsers, and EmsDestinations caches:
Note: When modifying your update rates, you should take your system architecture and number of elements per cache into account and ensure that you are not changing your update rates to values that might negatively impact system performance.
- Even when enabled, some Connection, Consumer, Destination, Producer, Queue, and Topic metrics are not collected by default. To modify the defaults, navigate to the Solution Package Configuration > TIBCO Enterprise Message Service > DATA COLLECTION > Metric Filters section.
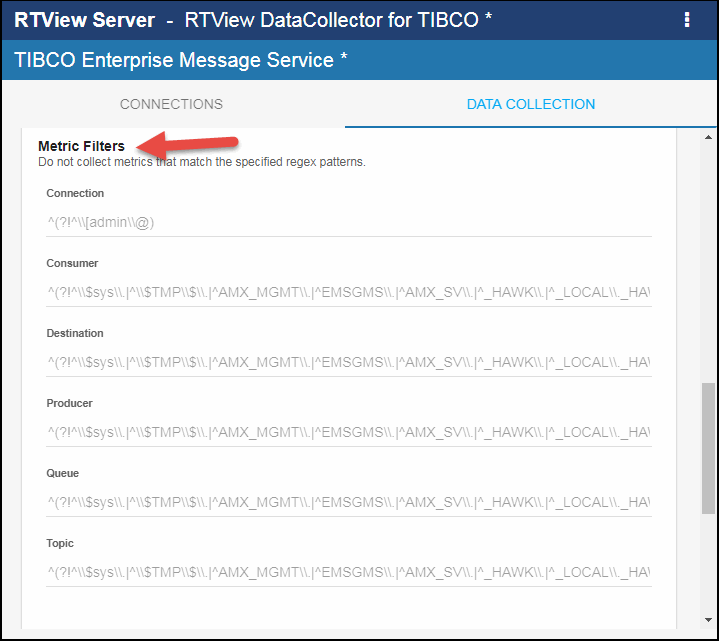
Each metric has a default regex pattern defined preventing metrics with the defined patterns from being collected. To edit the default:
a. Click on the desired field.
The Copy default text to clipboard link displays beneath the line.

b. Click the Copy default text to clipboard link to copy the text, click on the field, and paste (Ctrl-v) the text into the line.
c. Edit the regex pattern as desired.
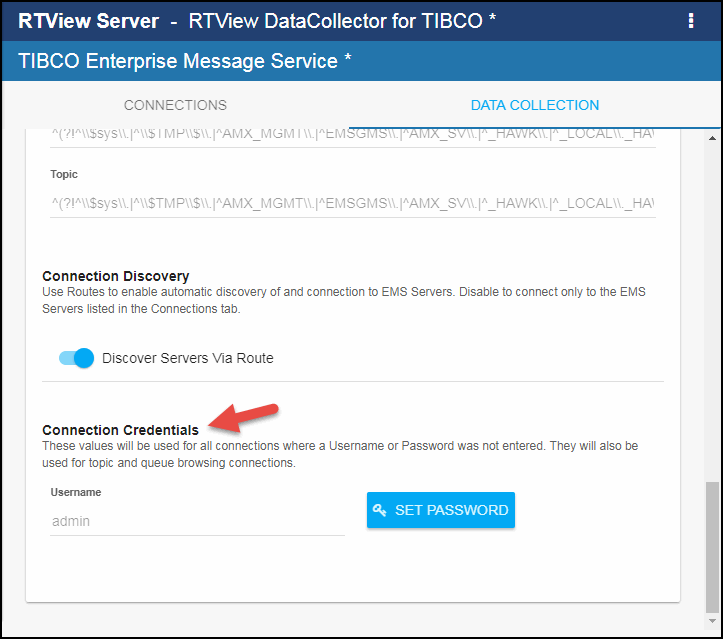
- If you want to turn off the auto-discovery of servers found via route definitions, navigate to Solution Package Configuration > TIBCO Enterprise Message Service > DATA COLLECTION tab > Connection Discovery and deselect the Discover Servers Via Route option.
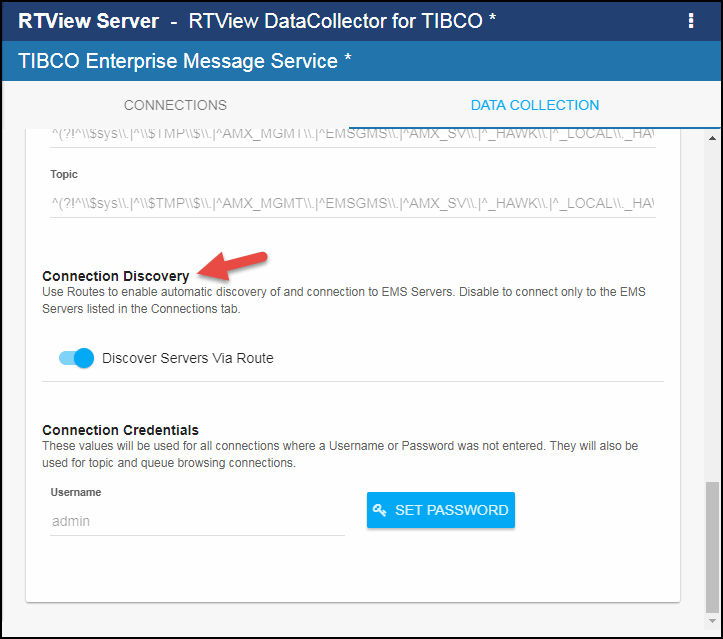
- Optionally enter the Username and Password in the Connection Credentials section. The defined Username and Password will be used for all connections defined on the Connections tab when a user name and password are not defined. This user name and password will also be used when making topic and queue browser connections. You can edit the Username field by clicking in the field and entering the desired user name. You can enter the password by clicking the Set Password button, which opens the Connections Credentials Password dialog, and entering the desired password. By default, the password entered is hidden. Click the icon to view the password text.
